Nokia 2003 Annual Report Download - page 57
Download and view the complete annual report
Please find page 57 of the 2003 Nokia annual report below. You can navigate through the pages in the report by either clicking on the pages listed below, or by using the keyword search tool below to find specific information within the annual report.-
 1
1 -
2
-
3
-
4
-
5
-
6
-
7
-
8
-
9
-
10
-
11
-
12
-
13
-
14
-
15
-
16
-
17
-
18
-
19
-
20
-
21
-
22
-
23
-
24
-
25
-
26
-
27
-
28
-
29
-
30
-
31
-
32
-
33
-
34
-
35
-
36
-
37
-
38
-
39
-
40
-
41
-
42
-
43
-
44
-
45
-
46
-
 47
47 -
 48
48 -
 49
49 -
 50
50 -
 51
51 -
 52
52 -
 53
53 -
 54
54 -
 55
55 -
 56
56 -
 57
57 -
 58
58 -
 59
59 -
 60
60 -
 61
61 -
 62
62 -
 63
63 -
 64
64 -
 65
65 -
 66
66 -
 67
67 -
68
-
69
-
70
-
71
-
72
-
73
-
74
-
75
-
76
-
77
-
78
-
79
-
80
-
81
-
82
-
83
-
84
-
85
-
86
-
87
-
88
-
89
-
90
-
91
-
92
-
93
-
94
-
95
-
96
-
97
-
98
-
99
-
100
-
101
-
102
-
103
-
104
-
105
-
106
-
107
-
108
-
109
-
110
-
111
-
112
-
113
-
114
-
115
-
116
-
117
-
118
-
119
-
120
-
121
-
122
-
123
-
124
-
125
-
126
-
127
-
128
-
129
-
130
-
131
-
132
-
133
-
134
-
135
-
136
-
137
-
138
-
139
-
140
-
141
-
142
-
143
-
144
-
145
-
146
-
147
-
148
-
149
-
150
-
151
-
152
-
153
-
154
-
155
-
156
-
157
-
158
-
159
-
160
-
161
-
162
-
163
-
164
-
165
-
166
-
167
-
168
-
169
-
170
-
171
-
172
-
173
-
174
 |
 |
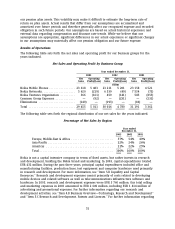
During 2002, operating profit was negatively impacted by a net charge of EUR 265 million in
relation to the obligations of MobilCom and by goodwill impairments of EUR 182 million primarily
in the Nokia Networks business. The goodwill impairments relate to Nokia Networks’ IP Mobility
Networks business as well as to Nokia Internet Communications within Nokia Ventures
Organization. We have evaluated the carrying value of goodwill arising from certain acquisitions
to determine if the carrying value exceeds recoverable amounts. The impairments were calculated
by comparing the discounted cash flows of the relevant business to the carrying value of assets for
this business. The net charge related to MobilCom is discussed below under ‘‘—Segment Results—
Nokia Networks’’ and ‘‘Item 5.B Liquidity and Capital Resources—Customer Financing.’’
Segment Results
Nokia Mobile Phones—Net sales of Nokia Mobile Phones were EUR 23 211 million in 2002, virtually
flat compared to EUR 23 158 million in 2001. Healthy sales growth in Europe and continued
growth in Asia-Pacific were offset by lower sales in the Americas. In addition, handset sales in the
second half of 2002, while high in volume, tended towards the less expensive mass-market end of
the product portfolio.
For 2002, Nokia sales volumes reached a record level of 152 million units compared with
140 million in 2001, representing faster than market growth of 9%, compared with 2001. Nokia
again increased its market share for the fifth consecutive year reaching an estimated 38% for the
full year 2002, based on the number of Nokia mobile phones sold into our distribution channels as
a percentage of estimated aggregate retail unit sales. In 2002, Nokia shipped a record number of
33 new mobile phone models.
According to Nokia’s preliminary estimates, the mobile phone market returned to growth in 2002
with overall market volumes reaching about 405 million units. This represents growth of more
than 5% compared with volumes in 2001 of around 380 million units. Replacement purchases are
estimated to have accounted for roughly half of the total industry sales volume in 2002 compared
with 45% in 2001. Market volume continued to grow year on year in Europe and Asia-Pacific, both
rising by approximately 8%. Demand in the Americas is estimated to have grown by
approximately 4%, compared with the previous year.
Nokia Mobile Phones continued to invest in research and development. Nokia Mobile Phones’
research and development costs totaled EUR 1 884 million (8.1% of Nokia Mobile Phones’ net sales)
in 2002 compared to EUR 1 599 million (6.9% of Nokia Mobile Phone’s net sales) in 2001.
Nokia Mobile Phones’ operating profit increased by 15% to EUR 5 201 million in 2002 compared to
EUR 4 521 million in 2001. Nokia Mobile Phones’ operating margin was 22.4% in 2002 and 19.5%
in 2001. The higher operating margin in Nokia Mobile Phones in 2002 resulted primarily from
lower product costs compared to 2001.
Nokia Networks—Net sales of Nokia Networks were EUR 6 539 million in 2002 compared to
EUR 7 534 million in 2001. Reduced investments by operators continued to have a significant
negative impact resulting in an overall sales decline of 13% compared with 2001. Net sales in 2002
included revenue related to single-mode WCDMA and dual-mode GSM/WCDMA network equipment,
as the relevant milestones for such recognition were met during the year.
During 2002, the combined effects of a general economic slowdown and high 3G license costs
induced most mobile network operators to focus increasingly on short-term cash flow generation
and debt reduction while cutting back on their level of capital investments. As a result, the size of
overall mobile network infrastructure market in 2002 decreased by approximately 20% compared
with the previous year, while Nokia Network’s accessible market contracted about 15% in 2002.
56