Nokia 2003 Annual Report Download - page 152
Download and view the complete annual report
Please find page 152 of the 2003 Nokia annual report below. You can navigate through the pages in the report by either clicking on the pages listed below, or by using the keyword search tool below to find specific information within the annual report.-
 1
1 -
2
-
3
-
4
-
5
-
6
-
7
-
8
-
9
-
10
-
11
-
12
-
13
-
14
-
15
-
16
-
17
-
18
-
19
-
20
-
21
-
22
-
23
-
24
-
25
-
26
-
27
-
28
-
29
-
30
-
31
-
32
-
33
-
34
-
35
-
36
-
37
-
38
-
39
-
40
-
41
-
42
-
43
-
44
-
45
-
46
-
47
-
48
-
49
-
50
-
51
-
52
-
53
-
54
-
55
-
56
-
57
-
58
-
59
-
60
-
61
-
62
-
63
-
64
-
65
-
66
-
67
-
68
-
69
-
70
-
71
-
72
-
73
-
74
-
75
-
76
-
77
-
78
-
79
-
80
-
81
-
82
-
83
-
84
-
85
-
86
-
87
-
88
-
89
-
90
-
91
-
92
-
93
-
94
-
95
-
96
-
97
-
98
-
99
-
100
-
101
-
102
-
103
-
104
-
105
-
106
-
107
-
108
-
109
-
110
-
111
-
112
-
113
-
114
-
115
-
116
-
117
-
118
-
119
-
120
-
121
-
122
-
123
-
124
-
125
-
126
-
127
-
128
-
129
-
130
-
131
-
132
-
133
-
134
-
135
-
136
-
137
-
138
-
139
-
140
-
141
-
 142
142 -
 143
143 -
 144
144 -
 145
145 -
 146
146 -
 147
147 -
 148
148 -
 149
149 -
 150
150 -
 151
151 -
 152
152 -
 153
153 -
 154
154 -
 155
155 -
 156
156 -
 157
157 -
 158
158 -
 159
159 -
 160
160 -
 161
161 -
 162
162 -
163
-
164
-
165
-
166
-
167
-
168
-
169
-
170
-
171
-
172
-
173
-
174
 |
 |
31JAN200410095061
Notes to the Consolidated Financial Statements (Continued)
34. Risk management (Continued)
(USD), UK pound sterling (GBP) and Australian dollar (AUD). In general, depreciation of another
currency relative to the euro has an adverse effect on Nokia’s sales and operating profit, while
appreciation of another currency has a positive effect, with the exception of Japanese yen, being
the only significant foreign currency in which Nokia has more purchases than sales.
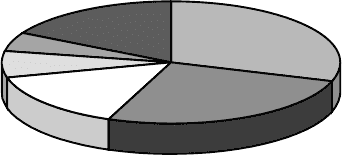
The following chart shows the break-down by currency of the underlying net foreign exchange
transaction exposure as of December 31, 2003 (in some of the currencies, especially the US dollar,
Nokia has both substantial sales as well as cost, which have been netted in the chart).
A
UD
7%
SEK
5%
Other
17%
USD
15% JPY
26%
GBP
30%
According to the foreign exchange policy guidelines of the Group, material transaction foreign
exchange exposures are hedged. Exposures are mainly hedged with derivative financial
instruments such as forward foreign exchange contracts and foreign exchange options. The
majority of financial instruments hedging foreign exchange risk have a duration of less than a
year. The Group does not hedge forecasted foreign currency cash flows beyond two years.
Nokia uses the Value-at-Risk (‘‘VaR’’) methodology to assess the foreign exchange risk related to
the Treasury management of the Group exposures. The VaR figure represents the potential fair
value losses for a portfolio resulting from adverse changes in market factors using a specified time
period and confidence level based on historical data. To correctly take into account the non-linear
price function of certain derivative instruments, Nokia uses Monte Carlo simulation. Volatilities and
correlations are calculated from a one-year set of daily data.
Since Nokia has subsidiaries outside the Eurozone, the euro-denominated value of the
shareholders’ equity of Nokia is also exposed to fluctuations in exchange rates. Equity changes
caused by movements in foreign exchange rates are shown as a translation difference in the
Group consolidation. Nokia uses, from time to time, foreign exchange contracts and foreign
currency denominated loans to hedge its equity exposure arising from foreign net investments.
Interest rate risk
The Group is exposed to interest rate risk either through market value fluctuations of balance
sheet items (i.e. price risk) and through changes in interest income or expenses (i.e. re-investment
risk). Interest rate risk mainly arises through interest-bearing liabilities and assets. Estimated
future changes in cash flows and balance sheet structure also expose the Group to interest rate
risk.
Treasury is responsible for monitoring and managing the interest rate exposure of the Group. Due
to the current balance sheet structure of Nokia, emphasis is placed on managing the interest rate
risk of investments.
F-43