Nokia 2003 Annual Report Download - page 33
Download and view the complete annual report
Please find page 33 of the 2003 Nokia annual report below. You can navigate through the pages in the report by either clicking on the pages listed below, or by using the keyword search tool below to find specific information within the annual report.-
 1
1 -
2
-
3
-
4
-
5
-
6
-
7
-
8
-
9
-
10
-
11
-
12
-
13
-
14
-
15
-
16
-
17
-
18
-
19
-
20
-
21
-
22
-
 23
23 -
 24
24 -
 25
25 -
 26
26 -
 27
27 -
 28
28 -
 29
29 -
 30
30 -
 31
31 -
 32
32 -
 33
33 -
 34
34 -
 35
35 -
 36
36 -
 37
37 -
 38
38 -
 39
39 -
 40
40 -
 41
41 -
 42
42 -
 43
43 -
44
-
45
-
46
-
47
-
48
-
49
-
50
-
51
-
52
-
53
-
54
-
55
-
56
-
57
-
58
-
59
-
60
-
61
-
62
-
63
-
64
-
65
-
66
-
67
-
68
-
69
-
70
-
71
-
72
-
73
-
74
-
75
-
76
-
77
-
78
-
79
-
80
-
81
-
82
-
83
-
84
-
85
-
86
-
87
-
88
-
89
-
90
-
91
-
92
-
93
-
94
-
95
-
96
-
97
-
98
-
99
-
100
-
101
-
102
-
103
-
104
-
105
-
106
-
107
-
108
-
109
-
110
-
111
-
112
-
113
-
114
-
115
-
116
-
117
-
118
-
119
-
120
-
121
-
122
-
123
-
124
-
125
-
126
-
127
-
128
-
129
-
130
-
131
-
132
-
133
-
134
-
135
-
136
-
137
-
138
-
139
-
140
-
141
-
142
-
143
-
144
-
145
-
146
-
147
-
148
-
149
-
150
-
151
-
152
-
153
-
154
-
155
-
156
-
157
-
158
-
159
-
160
-
161
-
162
-
163
-
164
-
165
-
166
-
167
-
168
-
169
-
170
-
171
-
172
-
173
-
174
 |
 |

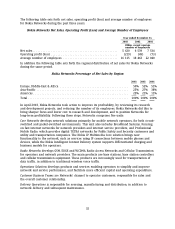
The following table sets forth net sales, operating profit (loss) and average number of employees
for Nokia Networks during the past three years.
Nokia Networks Net Sales, Operating Profit (Loss) and Average Number of Employees
Year ended December 31,
2003 2002 2001
EURm, except average
number of employees
Net sales ................................................... 5 620 6 539 7 534
Operating profit (loss) ........................................ (219) (49) (73)
Average number of employees ................................. 16 115 18 463 22 040
In addition the following table sets forth the regional distribution of net sales for Nokia Networks
during the same period.
Nokia Networks Percentage of Net Sales by Region
2003 2002 2001
Europe, Middle-East & Africa ......................................... 50% 52% 51%
Asia-Pacific ....................................................... 25% 27% 38%
Americas ......................................................... 25% 21% 11%
Total ............................................................ 100% 100% 100%
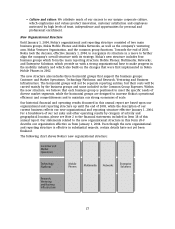
In April 2003, Nokia Networks took action to improve its profitability, by reviewing its research
and development projects, and reducing the number of its employees. Nokia Networks did this to
bring sharper focus and lower cost to research and development, and to position Networks for
long-term profitability. Following these steps, Networks comprises five units:
Core Networks develops network solutions primarily for mobile network operators, for both circuit-
switched and packet-switched environments. This unit also includes Broadband Systems, focusing
on fast internet networks for network providers and internet service providers, and Professional
Mobile Radio, which provides digital TETRA networks for Public Safety and Security customers and
utility and transportation companies. The Nokia IP Multimedia Core solution brings new
functionality to the network, such as services using IP connections between mobile phones and
devices, while the Nokia Intelligent Content Delivery system supports differentiated charging and
business models for operators.
Radio Networks develops GSM, EDGE and WCDMA Radio Access Networks and Cellular Transmission
for operators and network providers. The main products are base stations, base station controllers
and cellular transmission equipment. These products are increasingly used for transportation of
data traffic, in addition to traditional wireless voice traffic.
Operations Solutions develops products and services enabling operators to simplify and improve
network and service performance, and facilitate more efficient capital and operating expenditure.
Customer Business Teams are Networks’ channel to operator customers, responsible for sales and
the overall customer relationship.
Delivery Operations is responsible for sourcing, manufacturing and distribution, in addition to
network delivery and subsequent maintenance.
32