Nokia 2003 Annual Report Download - page 113
Download and view the complete annual report
Please find page 113 of the 2003 Nokia annual report below. You can navigate through the pages in the report by either clicking on the pages listed below, or by using the keyword search tool below to find specific information within the annual report.-
 1
1 -
2
-
3
-
4
-
5
-
6
-
7
-
8
-
9
-
10
-
11
-
12
-
13
-
14
-
15
-
16
-
17
-
18
-
19
-
20
-
21
-
22
-
23
-
24
-
25
-
26
-
27
-
28
-
29
-
30
-
31
-
32
-
33
-
34
-
35
-
36
-
37
-
38
-
39
-
40
-
41
-
42
-
43
-
44
-
45
-
46
-
47
-
48
-
49
-
50
-
51
-
52
-
53
-
54
-
55
-
56
-
57
-
58
-
59
-
60
-
61
-
62
-
63
-
64
-
65
-
66
-
67
-
68
-
69
-
70
-
71
-
72
-
73
-
74
-
75
-
76
-
77
-
78
-
79
-
80
-
81
-
82
-
83
-
84
-
85
-
86
-
87
-
88
-
89
-
90
-
91
-
92
-
93
-
94
-
95
-
96
-
97
-
98
-
99
-
100
-
101
-
102
-
 103
103 -
 104
104 -
 105
105 -
 106
106 -
 107
107 -
 108
108 -
 109
109 -
 110
110 -
 111
111 -
 112
112 -
 113
113 -
 114
114 -
 115
115 -
 116
116 -
 117
117 -
 118
118 -
 119
119 -
 120
120 -
 121
121 -
 122
122 -
 123
123 -
124
-
125
-
126
-
127
-
128
-
129
-
130
-
131
-
132
-
133
-
134
-
135
-
136
-
137
-
138
-
139
-
140
-
141
-
142
-
143
-
144
-
145
-
146
-
147
-
148
-
149
-
150
-
151
-
152
-
153
-
154
-
155
-
156
-
157
-
158
-
159
-
160
-
161
-
162
-
163
-
164
-
165
-
166
-
167
-
168
-
169
-
170
-
171
-
172
-
173
-
174
 |
 |

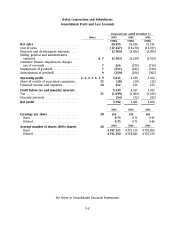
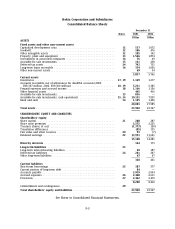
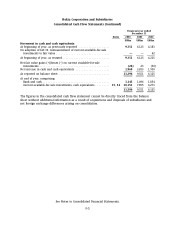
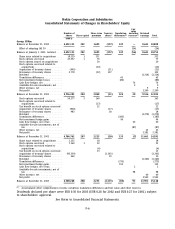
Nokia Corporation and Subsidiaries
Consolidated Cash Flow Statements
Financial year ended
December 31
Notes 2003 2002 2001
EURm EURm EURm
Cash flow from operating activities
Net profit ............................................... 3,592 3,381 2,200
Adjustments, total ...................................... 33 2,953 3,151 4,132
Net profit before change in net working capital ................. 6,545 6,532 6,332
Change in net working capital ............................. 33 (203) 955 978
Cash generated from operations ............................. 6,342 7,487 7,310
Interest received ....................................... 256 229 226
Interest paid .......................................... (33) (94) (155)
Other financial income and expenses ........................ 119 139 99
Income taxes paid ...................................... (1,440) (1,947) (933)
Net cash from operating activities .......................... 5,244 5,814 6,547
Cash flow from investing activities
Acquisition of Group companies, net of acquired cash
(2003: EUR 0 million, 2002: EUR 6 million, 2001: EUR 12 million) . . . (7) (10) (131)
Purchase of non-current available-for-sale investments ........... (282) (99) (323)
Purchase of shares in associated companies .................... (61) ——
Additions to capitalized development costs ..................... (218) (418) (431)
Long-term loans made to customers .......................... (97) (563) (1,129)
Proceeds from repayment and sale of long term loans receivable . . . 315 314 —
Proceeds from (+)/payment of (–) other long-term receivables ...... (18) (32) 84
Proceeds from (+)/payment of (–) short-term loans receivable ...... 63 (85) (114)
Capital expenditures ...................................... (432) (432) (1,041)
Proceeds from disposal of shares in Group companies, net of
disposed cash .......................................... —93 —
Proceeds from sale of non-current available-for-sale investments .... 381 162 204
Proceeds from sale of fixed assets ............................ 19 177 175
Dividends received ....................................... 24 25 27
Net cash used in investing activities ........................ (313) (868) (2,679)
Cash flow from financing activities
Proceeds from stock option exercises ......................... 23 163 77
Purchase of treasury shares ................................ (1,355) (17) (21)
Capital investment by minority shareholders ................... —26 4
Proceeds from long-term borrowings ......................... 8100 102
Repayment of long-term borrowings ......................... (56) (98) (59)
Proceeds from (+)/repayment of (–) short-term borrowings ........ (22) (406) (602)
Dividends paid .......................................... (1,378) (1,348) (1,396)
Net cash used in financing activities ........................ (2,780) (1,580) (1,895)
Foreign exchange adjustment .............................. (182) (163) (43)
Net increase in cash and cash equivalents .................... 1,969 3,203 1,930
Cash and cash equivalents at beginning of period ............. 9,351 6,125 4,183
Cash and cash equivalents at end of period .................. 11,320 9,328 6,113
Change in net fair value of current available-for-sale investments . (24) 23 12
As reported on balance sheet .............................. 11,296 9,351 6,125
F-4