Nokia 2003 Annual Report Download - page 154
Download and view the complete annual report
Please find page 154 of the 2003 Nokia annual report below. You can navigate through the pages in the report by either clicking on the pages listed below, or by using the keyword search tool below to find specific information within the annual report.-
 1
1 -
2
-
3
-
4
-
5
-
6
-
7
-
8
-
9
-
10
-
11
-
12
-
13
-
14
-
15
-
16
-
17
-
18
-
19
-
20
-
21
-
22
-
23
-
24
-
25
-
26
-
27
-
28
-
29
-
30
-
31
-
32
-
33
-
34
-
35
-
36
-
37
-
38
-
39
-
40
-
41
-
42
-
43
-
44
-
45
-
46
-
47
-
48
-
49
-
50
-
51
-
52
-
53
-
54
-
55
-
56
-
57
-
58
-
59
-
60
-
61
-
62
-
63
-
64
-
65
-
66
-
67
-
68
-
69
-
70
-
71
-
72
-
73
-
74
-
75
-
76
-
77
-
78
-
79
-
80
-
81
-
82
-
83
-
84
-
85
-
86
-
87
-
88
-
89
-
90
-
91
-
92
-
93
-
94
-
95
-
96
-
97
-
98
-
99
-
100
-
101
-
102
-
103
-
104
-
105
-
106
-
107
-
108
-
109
-
110
-
111
-
112
-
113
-
114
-
115
-
116
-
117
-
118
-
119
-
120
-
121
-
122
-
123
-
124
-
125
-
126
-
127
-
128
-
129
-
130
-
131
-
132
-
133
-
134
-
135
-
136
-
137
-
138
-
139
-
140
-
141
-
142
-
143
-
 144
144 -
 145
145 -
 146
146 -
 147
147 -
 148
148 -
 149
149 -
 150
150 -
 151
151 -
 152
152 -
 153
153 -
 154
154 -
 155
155 -
 156
156 -
 157
157 -
 158
158 -
 159
159 -
 160
160 -
 161
161 -
 162
162 -
 163
163 -
 164
164 -
165
-
166
-
167
-
168
-
169
-
170
-
171
-
172
-
173
-
174
 |
 |

Notes to the Consolidated Financial Statements (Continued)
34. Risk management (Continued)
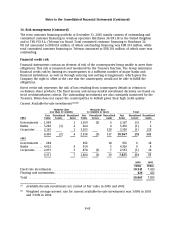
The term customer financing portfolio at December 31, 2003 mainly consists of outstanding and
committed customer financing to wireless operators Hutchison 3G UK Ltd in the United Kingdom
and to TNL PCS S.A. (Telemar) in Brazil. Total committed customer financing to Hutchison 3G
UK Ltd amounted to EUR 653 million, of which outstanding financing was EUR 354 million, while
total committed customer financing to Telemar amounted to EUR 191 million, of which none was
outstanding.
Financial credit risk
Financial instruments contain an element of risk of the counterparties being unable to meet their
obligations. This risk is measured and monitored by the Treasury function. The Group minimizes
financial credit risk by limiting its counterparties to a sufficient number of major banks and
financial institutions, as well as through entering into netting arrangements, which gives the
Company the right to offset in the case that the counterparty would not be able to fulfill the
obligations.
Direct credit risk represents the risk of loss resulting from counterparty default in relation to
on-balance sheet products. The fixed income and money market investment decisions are based on
strict creditworthiness criteria. The outstanding investments are also constantly monitored by the
Treasury. Nokia does not expect the counterparties to default given their high credit quality.
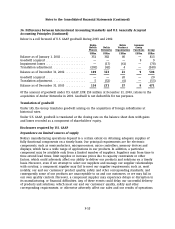
Current Available-for-sale investments(1)(2)(3)
Maturity date Maturity date
less than 12 months 12 months or more Total
Fair Unrealized Unrealized Fair Unrealized Unrealized Fair Unrealized Unrealized
2003 Value Losses Gains Value Losses Gains Value Losses Gains
Governments . . 1,058 1 1,109 (3) 6 2,167 (3) 7
Banks ........ 5,206 (1) 2 264 4 5,470 (1) 6
Corporates .... 2,165 1 1,165 128 3,330 (1) 128
8,430 (2) 4 2,538 (3) 137 10,967 (5) 141
2002
Governments . . 284 692 18 976 0 18
Banks ........ 4,012 4 314 5 4,326 0 8
Corporates .... 2,075 3 478 (1) 7 2,553 (1) 10
6,371 7 1,484 (1) 30 7,855 (1) 37
2003 2002
EURm EURm
Fixed rate investments ............................................... 10,541 7,433
Floating rate investments ............................................. 426 422
Total ............................................................. 10,967 7,855
(1) Available-for-sale investments are carried at fair value in 2003 and 2002.
(2) Weighted average interest rate for current available-for-sale investments was 3.08% in 2003
and 3.54% in 2002.
F-45