Nokia 2003 Annual Report Download - page 10
Download and view the complete annual report
Please find page 10 of the 2003 Nokia annual report below. You can navigate through the pages in the report by either clicking on the pages listed below, or by using the keyword search tool below to find specific information within the annual report.-
 1
1 -
 2
2 -
 3
3 -
 4
4 -
 5
5 -
 6
6 -
 7
7 -
 8
8 -
 9
9 -
 10
10 -
 11
11 -
 12
12 -
 13
13 -
 14
14 -
 15
15 -
 16
16 -
 17
17 -
 18
18 -
 19
19 -
 20
20 -
 21
21 -
22
-
23
-
24
-
25
-
26
-
27
-
28
-
29
-
30
-
31
-
32
-
33
-
34
-
35
-
36
-
37
-
38
-
39
-
40
-
41
-
42
-
43
-
44
-
45
-
46
-
47
-
48
-
49
-
50
-
51
-
52
-
53
-
54
-
55
-
56
-
57
-
58
-
59
-
60
-
61
-
62
-
63
-
64
-
65
-
66
-
67
-
68
-
69
-
70
-
71
-
72
-
73
-
74
-
75
-
76
-
77
-
78
-
79
-
80
-
81
-
82
-
83
-
84
-
85
-
86
-
87
-
88
-
89
-
90
-
91
-
92
-
93
-
94
-
95
-
96
-
97
-
98
-
99
-
100
-
101
-
102
-
103
-
104
-
105
-
106
-
107
-
108
-
109
-
110
-
111
-
112
-
113
-
114
-
115
-
116
-
117
-
118
-
119
-
120
-
121
-
122
-
123
-
124
-
125
-
126
-
127
-
128
-
129
-
130
-
131
-
132
-
133
-
134
-
135
-
136
-
137
-
138
-
139
-
140
-
141
-
142
-
143
-
144
-
145
-
146
-
147
-
148
-
149
-
150
-
151
-
152
-
153
-
154
-
155
-
156
-
157
-
158
-
159
-
160
-
161
-
162
-
163
-
164
-
165
-
166
-
167
-
168
-
169
-
170
-
171
-
172
-
173
-
174
 |
 |

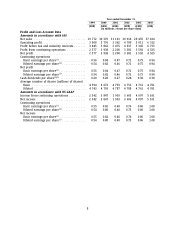
Year ended December 31,
1999 2000 2001 2002 2003 2003
(EUR) (EUR) (EUR) (EUR) (EUR) (USD)
(in millions, except per share data)
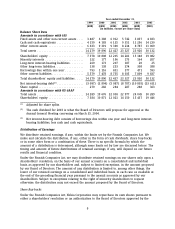
Balance Sheet Data
Amounts in accordance with IAS
Fixed assets and other non-current assets .... 3 487 6 388 6 912 5 742 3 837 4 833
Cash and cash equivalents ................ 4 159 4 183 6 125 9 351 11 296 14 230
Other current assets ..................... 6 633 9 319 9 390 8 234 8 787 11 069
Total assets ............................ 14 279 19 890 22 427 23 327 23 920 30 132
Shareholders’ equity ..................... 7 378 10 808 12 205 14 281 15 148 19 082
Minority interests ....................... 122 177 196 173 164 207
Long-term interest-bearing liabilities ........ 269 173 207 187 20 25
Other long-term liabilities ................. 138 138 253 274 308 388
Borrowings due within one year ........... 793 1 116 831 377 471 593
Other current liabilities ................... 5 579 7 478 8 735 8 035 7 809 9 837
Total shareholders’ equity and liabilities ..... 14 279 19 890 22 427 23 327 23 920 30 132
Net interest-bearing debt(3) ................ (3 097) (2 894) (5 087) (8 787) (10 805) (13 611)
Share capital ........................... 279 282 284 287 288 363
Amounts in accordance with US GAAP
Total assets ............................ 14 289 19 676 22 038 22 977 24 045 30 289
Shareholders’ equity ..................... 7 384 10 871 12 021 14 150 15 437 19 446
(1) Adjusted for share splits.
(2) The cash dividend for 2003 is what the Board of Directors will propose for approval at the
Annual General Meeting convening on March 25, 2004.
(3) Net interest-bearing debt consists of borrowings due within one year and long-term interest-
bearing liabilities, less cash and cash equivalents.
Distribution of Earnings
We distribute retained earnings, if any, within the limits set by the Finnish Companies Act. We
make and calculate the distribution, if any, either in the form of cash dividends, share buy-backs,
or in some other form or a combination of these. There is no specific formula by which the
amount of a distribution is determined, although some limits set by law are discussed below. The
timing and amount of future distributions of retained earnings, if any, will depend on our future
results and financial condition.
Under the Finnish Companies Act, we may distribute retained earnings on our shares only upon a
shareholders’ resolution, on the basis of our annual accounts on a consolidated and individual
basis, as approved by our shareholders and, subject to limited exceptions, in the amount proposed
by our Board of Directors. The amount of any distribution is limited to, among other things, the
lower of our retained earnings on a consolidated and individual basis, in each case as available at
the end of the preceding financial year pursuant to the annual accounts as approved by our
shareholders. Subject to exceptions relating to the right of minority shareholders to request
otherwise, the distribution may not exceed the amount proposed by the Board of Directors.
Share Buy-backs
Under the Finnish Companies Act, Nokia Corporation may repurchase its own shares pursuant to
either a shareholders’ resolution or an authorization to the Board of Directors approved by the
9