Nokia 2003 Annual Report Download - page 62
Download and view the complete annual report
Please find page 62 of the 2003 Nokia annual report below. You can navigate through the pages in the report by either clicking on the pages listed below, or by using the keyword search tool below to find specific information within the annual report.-
 1
1 -
2
-
3
-
4
-
5
-
6
-
7
-
8
-
9
-
10
-
11
-
12
-
13
-
14
-
15
-
16
-
17
-
18
-
19
-
20
-
21
-
22
-
23
-
24
-
25
-
26
-
27
-
28
-
29
-
30
-
31
-
32
-
33
-
34
-
35
-
36
-
37
-
38
-
39
-
40
-
41
-
42
-
43
-
44
-
45
-
46
-
47
-
48
-
49
-
50
-
51
-
 52
52 -
 53
53 -
 54
54 -
 55
55 -
 56
56 -
 57
57 -
 58
58 -
 59
59 -
 60
60 -
 61
61 -
 62
62 -
 63
63 -
 64
64 -
 65
65 -
 66
66 -
 67
67 -
 68
68 -
 69
69 -
 70
70 -
 71
71 -
 72
72 -
73
-
74
-
75
-
76
-
77
-
78
-
79
-
80
-
81
-
82
-
83
-
84
-
85
-
86
-
87
-
88
-
89
-
90
-
91
-
92
-
93
-
94
-
95
-
96
-
97
-
98
-
99
-
100
-
101
-
102
-
103
-
104
-
105
-
106
-
107
-
108
-
109
-
110
-
111
-
112
-
113
-
114
-
115
-
116
-
117
-
118
-
119
-
120
-
121
-
122
-
123
-
124
-
125
-
126
-
127
-
128
-
129
-
130
-
131
-
132
-
133
-
134
-
135
-
136
-
137
-
138
-
139
-
140
-
141
-
142
-
143
-
144
-
145
-
146
-
147
-
148
-
149
-
150
-
151
-
152
-
153
-
154
-
155
-
156
-
157
-
158
-
159
-
160
-
161
-
162
-
163
-
164
-
165
-
166
-
167
-
168
-
169
-
170
-
171
-
172
-
173
-
174
 |
 |

Nokia is not a capital intensive company in terms of fixed assets, but rather invests in research
and development, building the Nokia brand and marketing. In 2003, capital expenditures totaled
EUR 432 million, and were at the same level as in 2002 (EUR 432 million). In 2002 the decrease
was 59% compared to 2001 (EUR 1 041 million). This decrease over the three-year period is a
result of aligning our manufacturing capacity to match the slower market growth for mobile
phones and lower demand for network infrastructure. Principal capital expenditures during the
three years included office and manufacturing facilities, production lines, test equipment and
computer hardware used primarily in research and development. We expect the amount of our
capital expenditures during 2004 to be somewhat higher than 2003 and to be funded from our
cash flow from operations.
Customer Financing
Network operators in some markets sometimes require their suppliers, including us, to arrange or
provide long-term financing as a condition to obtaining or bidding on infrastructure projects.
Customer financing continues to be requested by some operators in some markets, but to a
considerably lesser extent and with considerably lower importance than during the past years.
Extended payment terms may continue to result in a material aggregate amount of trade credits,
but the associated risk is mitigated by the fact that the portfolio relates to a variety of customers.
See ‘‘Item 3.D Risk Factors—Customer financing to network operators can be a competitive
requirement and could affect our sales, results of operations, balance sheet and cash flow
adversely.’’
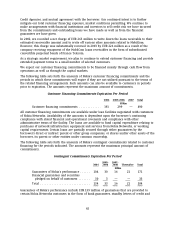
The following table sets forth Nokia’s total customer financing (outstanding and committed) for
the years indicated.
Customer Financing
At December 31,
2003 2002 2001
EURm
Financing commitments ....................................... 490 857 2 955
Outstanding long-term loans (net of allowances and write-offs) ........ 354 1 056 1 128
Outstanding financial guarantees and securities pledged ............. 33 91 127
Total ...................................................... 877 2 004 4 210
The term customer financing portfolio at December 31, 2003 mainly consists of outstanding and
committed customer financing to wireless operators Hutchison 3G UK Ltd in the United Kingdom
and to TNL PCS S.A. (Telemar) in Brazil. Total committed customer financing to Hutchison 3G
UK Ltd amounted to EUR 653 million, of which outstanding financing was EUR 354 million, while
total committed customer financing to Telemar amounted to EUR 191 million, of which none was
outstanding.
See Notes 7 and 34(b) to our consolidated financial statements included in Item 18 of this
Form 20-F for additional information relating to our committed and outstanding customer
financing.
In 2003, we reduced our total customer financing (outstanding and committed) by
EUR 1 127 million (or 56%) compared to 2002. Our outstanding loans have decreased mainly due
to the fact that the MobilCom loan was exchanged for subordinated convertible perpetual bonds of
France Telecom. These bonds are now treated as current available-for-sale investments. In
addition the reduction has been achieved through repayments of outstanding loans and release of
outstanding quarantees as well as arrangements with banks, financial institutions and Export
61