Nokia 2003 Annual Report Download - page 169
Download and view the complete annual report
Please find page 169 of the 2003 Nokia annual report below. You can navigate through the pages in the report by either clicking on the pages listed below, or by using the keyword search tool below to find specific information within the annual report.-
 1
1 -
2
-
3
-
4
-
5
-
6
-
7
-
8
-
9
-
10
-
11
-
12
-
13
-
14
-
15
-
16
-
17
-
18
-
19
-
20
-
21
-
22
-
23
-
24
-
25
-
26
-
27
-
28
-
29
-
30
-
31
-
32
-
33
-
34
-
35
-
36
-
37
-
38
-
39
-
40
-
41
-
42
-
43
-
44
-
45
-
46
-
47
-
48
-
49
-
50
-
51
-
52
-
53
-
54
-
55
-
56
-
57
-
58
-
59
-
60
-
61
-
62
-
63
-
64
-
65
-
66
-
67
-
68
-
69
-
70
-
71
-
72
-
73
-
74
-
75
-
76
-
77
-
78
-
79
-
80
-
81
-
82
-
83
-
84
-
85
-
86
-
87
-
88
-
89
-
90
-
91
-
92
-
93
-
94
-
95
-
96
-
97
-
98
-
99
-
100
-
101
-
102
-
103
-
104
-
105
-
106
-
107
-
108
-
109
-
110
-
111
-
112
-
113
-
114
-
115
-
116
-
117
-
118
-
119
-
120
-
121
-
122
-
123
-
124
-
125
-
126
-
127
-
128
-
129
-
130
-
131
-
132
-
133
-
134
-
135
-
136
-
137
-
138
-
139
-
140
-
141
-
142
-
143
-
144
-
145
-
146
-
147
-
148
-
149
-
150
-
151
-
152
-
153
-
154
-
155
-
156
-
157
-
158
-
 159
159 -
 160
160 -
 161
161 -
 162
162 -
 163
163 -
 164
164 -
 165
165 -
 166
166 -
 167
167 -
 168
168 -
 169
169 -
 170
170 -
 171
171 -
 172
172 -
 173
173 -
 174
174
 |
 |

Notes to the Consolidated Financial Statements (Continued)
36. Differences between International Accounting Standards and U.S. Generally Accepted
Accounting Principles (Continued)
2003 2002
Domestic Foreign Domestic Foreign
plans plans plans plans
EURm EURm
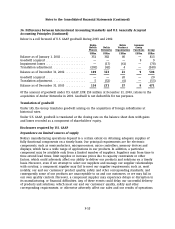
Plan assets at fair value at beginning of year ............. 636 126 664 123
Remeasurement .................................... —52 ——
Foreign exchange ................................... —(3)— (2)
Actual return on plan assets ........................... 27 13 (53) (12)
Employer contribution ............................... 27 20 32 22
Plan participants’ contributions ........................ —3—3
Benefits paid ....................................... (7) (7) (7) (8)
Plan assets at fair value at end of year .................. 683 204 636 126
Excess (deficit) of plan assets over
projected benefit obligation ........................... 17 (139) 97 (135)
Unrecognized transition obligation ...................... 2223
Unrecognized net (gain)/loss from experience differences .... 95 21 11 21
Unamortized prior service cost ......................... 32 — 34 —
Net amount recognized ............................... 146 (116) 144 (111)
Amounts recognized in the statement of financial positions
consist of:
Prepaid benefit cost ................................. 146 1 144 —
Accrued benefit liability .............................. — (117) — (116)
Intangible asset ..................................... ————
Accumulated other comprehensive income ............... ———5
Net amount recognized ............................... 146 (116) 144 (111)
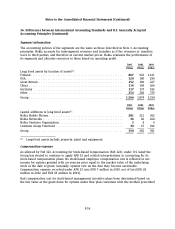
In both 2003 and 2002 the foreign plans had projected benefit obligations higher than assets. The
total Accumulated Benefit Obligation and Fair value of plan assets in respect of these plans were
EUR 281 million (EUR 229 million in 2002) and EUR 204 million (EUR 126 million in 2002)
respectively.
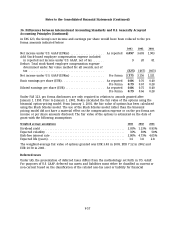
Weighted average assumptions used in calculation of pension obligations are as follows:
2003 2002
Domestic Foreign Domestic Foreign
%%%%
Discount rate for determining present values ............. 5.25 5.30 5.50 5.58
Expected long term rate of return on plan assets .......... 6.00 6.87 7.25 6.56
Annual rate of increase in future compensation levels ...... 3.50 3.49 3.50 3.09
Pension increases ................................... 2.30 2.27 2.30 2.29
The Group also contributes to multiemployer plans, insured plans and defined contribution plans.
Such contributions were approximately EUR 146 million, EUR 167 million and EUR 195 million in
2003, 2002 and 2001, respectively, including premiums associated with pooled benefits.
F-60