Nokia 2003 Annual Report Download - page 52
Download and view the complete annual report
Please find page 52 of the 2003 Nokia annual report below. You can navigate through the pages in the report by either clicking on the pages listed below, or by using the keyword search tool below to find specific information within the annual report.-
 1
1 -
2
-
3
-
4
-
5
-
6
-
7
-
8
-
9
-
10
-
11
-
12
-
13
-
14
-
15
-
16
-
17
-
18
-
19
-
20
-
21
-
22
-
23
-
24
-
25
-
26
-
27
-
28
-
29
-
30
-
31
-
32
-
33
-
34
-
35
-
36
-
37
-
38
-
39
-
40
-
41
-
 42
42 -
 43
43 -
 44
44 -
 45
45 -
 46
46 -
 47
47 -
 48
48 -
 49
49 -
 50
50 -
 51
51 -
 52
52 -
 53
53 -
 54
54 -
 55
55 -
 56
56 -
 57
57 -
 58
58 -
 59
59 -
 60
60 -
 61
61 -
 62
62 -
63
-
64
-
65
-
66
-
67
-
68
-
69
-
70
-
71
-
72
-
73
-
74
-
75
-
76
-
77
-
78
-
79
-
80
-
81
-
82
-
83
-
84
-
85
-
86
-
87
-
88
-
89
-
90
-
91
-
92
-
93
-
94
-
95
-
96
-
97
-
98
-
99
-
100
-
101
-
102
-
103
-
104
-
105
-
106
-
107
-
108
-
109
-
110
-
111
-
112
-
113
-
114
-
115
-
116
-
117
-
118
-
119
-
120
-
121
-
122
-
123
-
124
-
125
-
126
-
127
-
128
-
129
-
130
-
131
-
132
-
133
-
134
-
135
-
136
-
137
-
138
-
139
-
140
-
141
-
142
-
143
-
144
-
145
-
146
-
147
-
148
-
149
-
150
-
151
-
152
-
153
-
154
-
155
-
156
-
157
-
158
-
159
-
160
-
161
-
162
-
163
-
164
-
165
-
166
-
167
-
168
-
169
-
170
-
171
-
172
-
173
-
174
 |
 |

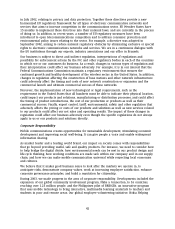
our pension plan assets. This volatility may make it difficult to estimate the long-term rate of
return on plan assets. Actual results that differ from our assumptions are accumulated and
amortized over future periods and therefore generally affect our recognized expense and recorded
obligation in such future periods. Our assumptions are based on actual historical experience and
external data regarding compensation and discount rate trends. While we believe that our
assumptions are appropriate, significant differences in our actual experience or significant changes
in our assumptions may materially affect our pension obligation and our future expense.
Results of Operations
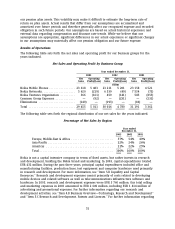
The following table sets forth the net sales and operating profit for our business groups for the
years indicated.
Net Sales and Operating Profit by Business Group
Year ended December 31,
2003 2002 2001
Net Operating Net Operating Net Operating
Sales Profit/(Loss) Sales Profit/(Loss) Sales Profit/(Loss)
EURm
Nokia Mobile Phones ................ 23 618 5 483 23 211 5 201 23 158 4 521
Nokia Networks .................... 5 620 (219) 6 539 (49) 7 534 (73)
Nokia Ventures Organization ......... 366 (161) 459 (141) 585 (855)
Common Group Expenses ............ — (92) — (231) — (231)
Eliminations ...................... (149) — (193) — (86) —
Total ............................ 29 455 5 011 30 016 4 780 31 191 3 362
The following table sets forth the regional distribution of our net sales for the years indicated.
Percentage of Net Sales by Region
Year ended
December 31,
2003 2002 2001
Europe, Middle-East & Africa ......................... 57% 54% 49%
Asia-Pacific ....................................... 22% 24% 26%
Americas ........................................ 21% 22% 25%
Total ............................................ 100% 100% 100%
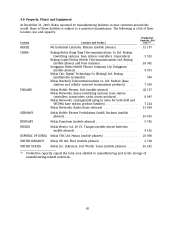
Nokia is not a capital intensive company in terms of fixed assets, but rather invests in research
and development, building the Nokia brand and marketing. In 2003, capital expenditures totaled
EUR 432 million. During the past three years, principal capital expenditures included office and
manufacturing facilities, production lines, test equipment and computer hardware used primarily
in research and development. For more information, see ‘‘Item 5.B Liquidity and Capital
Resources.’’ Research and development expenses consist primarily of costs related to developing
mobile devices and related software as well as telecommunications infrastructure software and
hardware. In 2003, research and development expenses were EUR 3 760 million. Our total selling
and marketing expenses in 2003 amounted to EUR 2 649 million, including EUR 1 414 million of
advertising and promotional expenses. For further information regarding our research and
development activities, see ‘‘Item 4.B Business Overview—Technology, Research and Development’’
and ‘‘Item 5.C Research and Development, Patents and Licenses.’’ For further information regarding
51