IBM 2003 Annual Report Download - page 96
Download and view the complete annual report
Please find page 96 of the 2003 IBM annual report below. You can navigate through the pages in the report by either clicking on the pages listed below, or by using the keyword search tool below to find specific information within the annual report.-
 1
1 -
2
-
3
-
4
-
5
-
6
-
7
-
8
-
9
-
10
-
11
-
12
-
13
-
14
-
15
-
16
-
17
-
18
-
19
-
20
-
21
-
22
-
23
-
24
-
25
-
26
-
27
-
28
-
29
-
30
-
31
-
32
-
33
-
34
-
35
-
36
-
37
-
38
-
39
-
40
-
41
-
42
-
43
-
44
-
45
-
46
-
47
-
48
-
49
-
50
-
51
-
52
-
53
-
54
-
55
-
56
-
57
-
58
-
59
-
60
-
61
-
62
-
63
-
64
-
65
-
66
-
67
-
68
-
69
-
70
-
71
-
72
-
73
-
74
-
75
-
76
-
77
-
78
-
79
-
80
-
81
-
82
-
83
-
84
-
85
-
 86
86 -
 87
87 -
 88
88 -
 89
89 -
 90
90 -
 91
91 -
 92
92 -
 93
93 -
 94
94 -
 95
95 -
 96
96 -
 97
97 -
 98
98 -
 99
99 -
 100
100 -
 101
101 -
 102
102 -
 103
103 -
 104
104 -
 105
105 -
 106
106 -
107
-
108
-
109
-
110
-
111
-
112
-
113
-
114
-
115
-
116
-
117
-
118
-
119
-
120
-
121
-
122
-
123
-
124
-
125
-
126
-
127
-
128
 |
 |

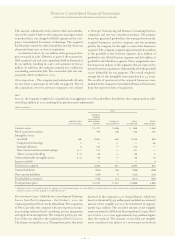
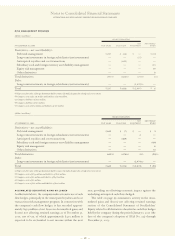
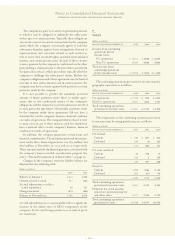
GOODWILL
The changes in the carrying amount of goodwill, by reporting segment, for the year ended December 31, 2003, are as follows:
(dollars in millions)
FOREIGN
BALANCE PURCHASE CURRENCY BALANCE
JAN. 1, GOODWILL PRICE TRANSLATION DEC. 31,
SEGMENT 2003 ADDITIONS ADJUSTMENTS DIVESTITURES ADJUSTMENTS 2003
Global Services $«2,926 $««««203*$«694 $«(6) $«367 $«4,184
Systems Group 137 ————137
Personal Systems Group 13 58 — — — 71
Technology Group 24 ————24
Software 1,015 1,439 40 — 11 2,505
Global Financing ——————
Enterprise Investments ——————
Total $«4,115 $«1,700 $«734 $«(6) $«378 $«6,921
*Relates to the purchase of the minority interest in a consolidated subsidiary.
There were no goodwill impairment losses recorded during the period.
94
Notes to Consolidated Financial Statements
INTERNATIONAL BUSINESS MACHINES CORPORATION AND SUBSIDIARY COMPANIES
H
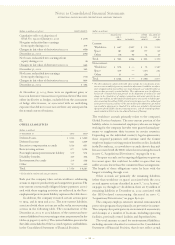
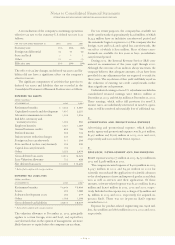
investments and sundry assets
(dollars in millions)
AT D ECEMBER 31: 2003 2002*
Deferred taxes $«4,288 $«4,314
Alliance investments:
Equity method 560 562
Other 234 249
Software 814 834
Derivatives—non-current** 695 689
Receivable from Hitachi+358 356
Marketable securities—non-current 59 192
Other assets 1,100 1,076
Total $«8,108 $«8,272
*Reclassified to conform with 2003 presentation.
** See note L, “Derivatives and Hedging Transactions,” on pages 96 to 99 for the fair
value of all derivatives reported in the Consolidated Statement of Financial Position.
+See note C, “Acquisitions/Divestitures,” on pages 89 to 92 for additional information.
I
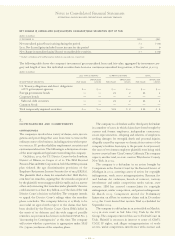
intangible assets including goodwill
The following schedule details the company’s intangible asset
balances by major asset class.
(dollars in millions)
AT DECEMBER 31, 2002
GROSS NET
CARRYING ACCUMULATED CARRYING
INTANGIBLE ASSET CLASS AMOUNT AMORTIZATION AMOUNT
Client-related $««««517 $«(124) $«393
Completed technology 229 (108) 121
Strategic alliances 118 (15) 103
Patents/trademarks 109 (80) 29
Other*98 (7) 91
Total $«1,071 $«(334) $«737**
*Other intangibles are primarily acquired proprietary and nonproprietary business
processes, methodologies and systems.
** The $910 million at December 31, 2003, comprises $336 million recorded as current
assets and $574 million recorded as non-current assets. The $737 million at December 31,
2002, comprises $245 million recorded as current assets and $492 million recorded as
non-current assets.
(dollars in millions)
AT DECEMBER 31, 2003
GROSS NET
CARRYING ACCUMULATED CARRYING
INTANGIBLE ASSET CLASS AMOUNT AMORTIZATION AMOUNT
Client-related $««««704 $«(254) $«450
Completed technology 448 (228) 220
Strategic alliances 118 (38) 80
Patents/trademarks 98 (66) 32
Other*165 (37) 128
Total $«1,533 $«(623) $«910**
The net carrying amount of intangible assets increased by
$173 million for the year ended December 31, 2003, primarily
due to the acquisition of Rational, offset by the amortization
of existing intangible asset balances.
The aggregate amortization expense was $349 million
and $181 million for the years ended December 31, 2003 and
2002, respectively.
The future amortization expense for each of the five suc-
ceeding years relating to intangible assets currently recorded in
the Consolidated Statement of Financial Position is estimated
to be the following at December 31, 2003:
(dollars in millions)
2004 $«336
2005 261
2006 141
2007 84
2008 51