IBM 2003 Annual Report Download - page 120
Download and view the complete annual report
Please find page 120 of the 2003 IBM annual report below. You can navigate through the pages in the report by either clicking on the pages listed below, or by using the keyword search tool below to find specific information within the annual report.-
 1
1 -
2
-
3
-
4
-
5
-
6
-
7
-
8
-
9
-
10
-
11
-
12
-
13
-
14
-
15
-
16
-
17
-
18
-
19
-
20
-
21
-
22
-
23
-
24
-
25
-
26
-
27
-
28
-
29
-
30
-
31
-
32
-
33
-
34
-
35
-
36
-
37
-
38
-
39
-
40
-
41
-
42
-
43
-
44
-
45
-
46
-
47
-
48
-
49
-
50
-
51
-
52
-
53
-
54
-
55
-
56
-
57
-
58
-
59
-
60
-
61
-
62
-
63
-
64
-
65
-
66
-
67
-
68
-
69
-
70
-
71
-
72
-
73
-
74
-
75
-
76
-
77
-
78
-
79
-
80
-
81
-
82
-
83
-
84
-
85
-
86
-
87
-
88
-
89
-
90
-
91
-
92
-
93
-
94
-
95
-
96
-
97
-
98
-
99
-
100
-
101
-
102
-
103
-
104
-
105
-
106
-
107
-
108
-
109
-
 110
110 -
 111
111 -
 112
112 -
 113
113 -
 114
114 -
 115
115 -
 116
116 -
 117
117 -
 118
118 -
 119
119 -
 120
120 -
 121
121 -
 122
122 -
 123
123 -
 124
124 -
 125
125 -
 126
126 -
 127
127 -
 128
128
 |
 |

certain IP income, miscellaneous tax items, pre-divestiture
HDD internal activity from continuing operations and the
unallocated corporate expense pool are recorded in net
income but are not allocated to the segments.
Over recent years, the company has been developing and
enhancing a “one team” approach to the collaboration
between the Systems Group and Technology Group. This
relationship is crucial given the core technology of the
Systems Group products are a key competitive differentiator
for the company. The degree of this collaboration has
increased whereby in 2004, the company is managing these
groups as one. Accordingly, in the first quarter of 2004, the
company combined the two segments into one reporting
segment. The new Systems and Technology Group segment
will generate one consolidated set of financial results, which
senior management will use for joint strategy, budgets, and
resource allocation decisions, as well as performance and
compensation scoring.
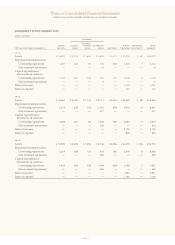
The following tables reflect the results of continuing
operations of the segments consistent with the company’s
management system. These results are not necessarily a
depiction that is in conformity with GAAP; e.g., employee
retirement plan costs are developed using actuarial assump-
tions on a country-by-country basis and allocated to the
segments based on headcount. Different amounts could
result if actuarial assumptions that are unique to the segment
were used. Performance measurement is based on income
before income taxes (pre-tax income). These results are used,
in part, by management, both in evaluating the performance
of, and in allocating resources to, each of the segments.
Notes to Consolidated Financial Statements
INTERNATIONAL BUSINESS MACHINES CORPORATION AND SUBSIDIARY COMPANIES
118
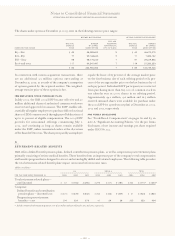
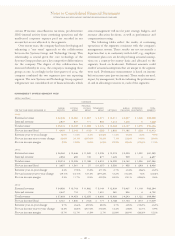
MANAGEMENT SYSTEM SEGMENT VIEW
(dollars in millions)
HARDWARE
PERSONAL
GLOBAL SYSTEMS SYSTEMS TECHNOLOGY GLOBAL ENTERPRISE TOTAL
FOR THE YEAR ENDED DECEMBER 31: SERVICES GROUP GROUP GROUP SOFTWARE FINANCING INVESTMENTS SEGMENTS
2003:
External revenue $«42,635 $«14,002 $«11,387 $««2,871 $«14,311 $«2,827 $«1,065 $«89,098
Internal revenue 2,837 837 171 805 1,613 1,300 5 7,568
Total revenue $«45,472 $«14,839 $«11,558 $««3,676 $«15,924 $«4,127 $«1,070 $«96,666
Pre-tax income/(loss) $«««4,499 $«««2,046 $«««««(118) $««««(252) $«««3,808 $«1,182 $«««(252) $«10,913
Revenue year-to-year change 16.0% 11.5% 3.3% (23.6) % 11.4% (0.4) % 4.3% 9.9%
Pre-tax income year-to-year change 23.0% 31.1% (307.0) % 76.2% 7.1% 23.8% 14.0% 29.4%
Pre-tax income margin 9.9% 13.8% (1.0) % (6.9) % 23.9% 28.6% (23.6) % 11.3%
2002:
External revenue $«36,360 $«12,646 $«11,049 $««3,935 $«13,074 $«3,203 $«1,022 $«81,289
Internal revenue 2,854 659 139 877 1,225 939 4 6,697
Total revenue $«39,214 $«13,305 $«11,188 $««4,812 $«14,299 $«4,142 $«1,026 $«87,986
Pre-tax income/(loss) $«««3,657 $«««1,561 $««««««««57 $«(1,057) $«««3,556 $««««955 $«««(293) $«««8,436
Revenue year-to-year change 4.3% (7.9) % (7.2) % (27.1) % 2.7% (2.4) % (8.6) % (2.2) %
Pre-tax income year-to-year change (29.1) % (14.7) % 137.3% (697.2) % 12.2% (16.4) % 7.6% (23.4) %
Pre-tax income margin 9.3% 11.7% 0.5% (22.0) % 24.9% 23.1% (28.6) % 9.6%
2001:
External revenue $«34,956 $«13,743 $«11,982 $««5,149 $«12,939 $«3,407 $«1,118 $«83,294
Internal revenue 2,647 710 73 1,451 981 836 4 6,702
Total revenue $«37,603 $«14,453 $«12,055 $««6,600 $«13,920 $«4,243 $«1,122 $«89,996
Pre-tax income/(loss) $«««5,161 $«««1,830 $«««««(153) $«««««177 $«««3,168 $«1,143 $«««(317) $«11,009
Revenue year-to-year change 5.7% (2.6) % (20.5) % (8.0) % 3.7% (4.5) % (18.2) % (2.2) %
Pre-tax income year-to-year change 14.3% (4.8) % (251.5) % (74.6) % 13.4% (2.8) % (6.7) % 0.9%
Pre-tax income margin 13.7% 12.7% (1.3) % 2.7% 22.8% 26.9% (28.3) % 12.2%