IBM 2003 Annual Report Download - page 57
Download and view the complete annual report
Please find page 57 of the 2003 IBM annual report below. You can navigate through the pages in the report by either clicking on the pages listed below, or by using the keyword search tool below to find specific information within the annual report.-
 1
1 -
2
-
3
-
4
-
5
-
6
-
7
-
8
-
9
-
10
-
11
-
12
-
13
-
14
-
15
-
16
-
17
-
18
-
19
-
20
-
21
-
22
-
23
-
24
-
25
-
26
-
27
-
28
-
29
-
30
-
31
-
32
-
33
-
34
-
35
-
36
-
37
-
38
-
39
-
40
-
41
-
42
-
43
-
44
-
45
-
46
-
 47
47 -
 48
48 -
 49
49 -
 50
50 -
 51
51 -
 52
52 -
 53
53 -
 54
54 -
 55
55 -
 56
56 -
 57
57 -
 58
58 -
 59
59 -
 60
60 -
 61
61 -
 62
62 -
 63
63 -
 64
64 -
 65
65 -
 66
66 -
 67
67 -
68
-
69
-
70
-
71
-
72
-
73
-
74
-
75
-
76
-
77
-
78
-
79
-
80
-
81
-
82
-
83
-
84
-
85
-
86
-
87
-
88
-
89
-
90
-
91
-
92
-
93
-
94
-
95
-
96
-
97
-
98
-
99
-
100
-
101
-
102
-
103
-
104
-
105
-
106
-
107
-
108
-
109
-
110
-
111
-
112
-
113
-
114
-
115
-
116
-
117
-
118
-
119
-
120
-
121
-
122
-
123
-
124
-
125
-
126
-
127
-
128
 |
 |

On January 1, 2003, the company reduced its expected
long-term return assumption on the U. S. IBM Personal
Pension Plan’s (PPP) assets from 9.5 percent to 8 percent. On
December 31, 2002, the company lowered its discount rate
assumption from 7 percent to 6.75 percent, and lowered its
rate of compensation increase from 6 percent to 4 percent.
Reductions in these rates also occurred in certain non-U. S.
countries. The company voluntarily fully funded the tax-
qualified portion of the PPP, as measured by its accumulated
benefit obligation, through a contribution of cash and IBM
stock totaling $3,963 million in the fourth quarter of 2002.
These assumption changes and funding action had the col-
lective net effect of causing the reduction in the Retirement-
related plans—cost/(income) amount displayed on page 54.
See the Looking Forward section on page 64 for the impact
of assumption changes on the 2004 Retirement-related
plans—cost/(income). Also see pages 110 to 117 for addi-
tional information relating to the company’s retirement-
related plans including assumptions and method used to
determine assumptions.
Provision for Income Taxes
The provision for income taxes resulted in an effective tax
rate of 30.0 percent for 2003, compared with the 2002 effec-
tive tax rate of 29.1 percent. The increase in the effective tax
rate in 2003 versus 2002 was primarily due to a less favorable
mix of geographic income and the absence of the tax benefit
associated with the Microelectronics actions taken in the
second quarter of 2002.
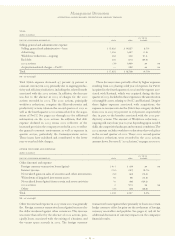
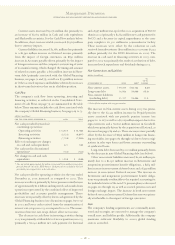
Weighted-Average Common Shares
YR. TO YR.
FOR THE YEAR ENDED DECEMBER 31: 2003 2002 CHANGE
Earnings per share from
continuing operations:
Assuming dilution $«««««4.34 $«««««3.07 41.4%
Basic 4.42 3.13 41.2
Weighted-average shares
outstanding: (in millions)
Assuming dilution 1,756.1 1,730.9 1.5%
Basic 1,721.6 1,703.2 1.1
The average number of common shares outstanding assuming
dilution was higher by 25.2 million shares in 2003 versus
2002. The increase was primarily the result of the company’s
use of common shares to fund a portion of its fourth quarter
2002 contribution to the PPP and common shares associated
with the acquisition of PwCC, partially offset by the
company’s common share repurchase program. See note N,
“Stockholders’ Equity Activity,” on pages 100 and 101 for
additional information regarding the common share activities.
Also see note T, “Earnings Per Share of Common Stock,” on
page 108.
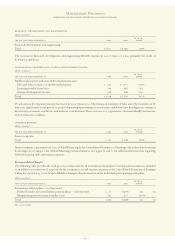
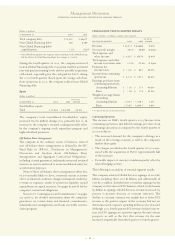
SEGMENT DETAILS
The following is an analysis of the 2003 versus 2002 external
segment results. The analysis of 2002 versus 2001 external
segment results is on pages 61 and 62.
Global Services
(dollars in millions)
YR.
TO YR.
FOR THE YEAR ENDED DECEMBER 31: 2003 2002*CHANGE
Global Services Revenue: $«42,635 $«36,360 17.3%
Strategic Outsourcing $«17,124 $«14,995 14.2%
Business Consulting 12,955 9,424 37.5
Integrated Technology 7,099 6,871 3.3
Maintenance 5,457 5,070 7.6
*Reclassified to conform with 2003 presentation.
Global Services revenue increased 17.3 percent (9.3 percent
at constant currency) in 2003 versus 2002. SO revenue
increased in 2003 primarily driven by new signings. SO con-
tinued to demonstrate its competitive advantage in delivering
on demand solutions by leveraging its business transformation
skills and its scale during 2003. e-business Hosting Services,
an offering that provides Web infrastructure and application
management as an Internet-based service, continued its
strong pattern of revenue growth. BCS revenue increased in
2003 due to the acquisition of PwCC in the fourth quarter of
2002. ITS revenue increased due to the favorable impact of
currency movements. During 2003, the company changed its
reporting for certain OEM hardware sales to IBM clients
from gross to net revenue treatment based upon a review of
the terms of these sales. The company determined that the
agent-like characteristics of these transactions were more
appropriately recorded on a net revenue basis. Due to the
amounts involved, the prior year amounts were not adjusted.
As a result of this change in 2003, revenue and costs for ITS
were lower by $279 million in 2003 as compared to 2002,
partially offsetting the currency impact discussed above.
This change had no impact on the company’s gross profit
dollars, net income or cash flows.
Management Discussion
INTERNATIONAL BUSINESS MACHINES CORPORATION AND SUBSIDIARY COMPANIES
55
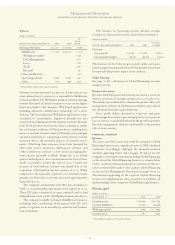
(dollars in millions)
YR. TO YR.
FOR THE YEAR ENDED DECEMBER 31: 2003 2002 CHANGE
Global Services:
Gross profit $«10,732 $«9,548 12.4%
Gross profit margin 25.2% 26.3% (1.1) pts.