IBM 2003 Annual Report Download - page 72
Download and view the complete annual report
Please find page 72 of the 2003 IBM annual report below. You can navigate through the pages in the report by either clicking on the pages listed below, or by using the keyword search tool below to find specific information within the annual report.-
 1
1 -
2
-
3
-
4
-
5
-
6
-
7
-
8
-
9
-
10
-
11
-
12
-
13
-
14
-
15
-
16
-
17
-
18
-
19
-
20
-
21
-
22
-
23
-
24
-
25
-
26
-
27
-
28
-
29
-
30
-
31
-
32
-
33
-
34
-
35
-
36
-
37
-
38
-
39
-
40
-
41
-
42
-
43
-
44
-
45
-
46
-
47
-
48
-
49
-
50
-
51
-
52
-
53
-
54
-
55
-
56
-
57
-
58
-
59
-
60
-
61
-
 62
62 -
 63
63 -
 64
64 -
 65
65 -
 66
66 -
 67
67 -
 68
68 -
 69
69 -
 70
70 -
 71
71 -
 72
72 -
 73
73 -
 74
74 -
 75
75 -
 76
76 -
 77
77 -
 78
78 -
 79
79 -
 80
80 -
 81
81 -
 82
82 -
83
-
84
-
85
-
86
-
87
-
88
-
89
-
90
-
91
-
92
-
93
-
94
-
95
-
96
-
97
-
98
-
99
-
100
-
101
-
102
-
103
-
104
-
105
-
106
-
107
-
108
-
109
-
110
-
111
-
112
-
113
-
114
-
115
-
116
-
117
-
118
-
119
-
120
-
121
-
122
-
123
-
124
-
125
-
126
-
127
-
128
 |
 |

Customer participation rates are the propensity of IBM’s
clients to finance their purchases through Global Financing
in lieu of paying IBM up-front cash.
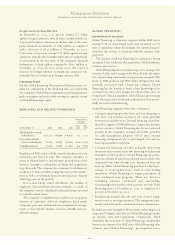
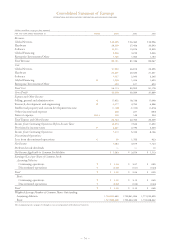
RESULTS OF OPERATIONS
(dollars in millions)
FOR THE YEAR ENDED DECEMBER 31: 2003 2002 2001
External revenue $«2,827 $«3,203 $«3,407
Internal revenue 1,300 939 836
Total revenue 4,127 4,142 4,243
Cost 1,846 1,803 2,016
Gross profit $«2,281 $«2,339 $«2,227
Gross profit margin 55.3% 56.5% 52.5%
Pre-tax income $«1,182 $««««955 $«1,143
After-tax income $««««766 $««««627 $««««727
Return on equity*22.3% 17.2% 18.4%
*Return on equity is calculated using a five-point average of equity and an estimated tax
rate principally based on Global Financing’s geographic mix of earnings, as IBM’s
provision for income taxes is determined on a consolidated basis. See page 55 for the
IBM consolidated tax rate.
Global Financing revenue was flat in 2003 as compared to
2002. External revenue decreased 11.7 percent (18 percent at
constant currency) in 2003 versus 2002 driven by lower
financing income, due to declining interest rates and a lower
average asset base, and a decrease in external used equip-
ment sales. The lower average asset base was primarily due to
lower originations in prior years. Internal revenue increased
38.4 percent in 2003 versus 2002 driven by internal used
equipment sales, primarily zSeries. Global Financing remar-
kets used equipment, primarily resulting from returns off of
lease, both externally and internally. Externally remarketed
equipment represents sales to clients and resellers, while
internally remarketed equipment primarily represents used
equipment that is sold internally and then remarketed exter-
nally through the Hardware segment.
Global Financing revenue decreased 2.4 percent in 2002
versus 2001. The decrease in external revenue was driven
by lower financing income due to a lower average asset base
discussed above partially offset by an increase in external
used equipment sales. The decline in external revenue was
offset by an increase in internal revenue due to an increase in
internal used equipment sales. See discussion above.
Global Financing gross profit dollars decreased 2.5 percent
and the gross profit margin declined 1.2 points in 2003 versus
2002. The decrease in gross profit dollars was primarily
driven by declining interest rates and a lower average asset
base discussed above partially offset by improved financing
margins. The decrease in gross profit margin was driven by a
mix change towards lower margin remarketing sales and away
from financing income partially offset by lower borrowing
costs related to the current interest rate environment.
Global Financing gross profit dollars increased 5.0 percent
and the gross profit margin increased 4.0 points in 2002 versus
2001. The increases in 2002 gross profit dollars and gross
profit margin were primarily driven by lower borrowing costs.
Global Financing pre-tax income increased 23.8 percent
in 2003 versus 2002, following a decrease of 16.4 percent in
2002 versus 2001. The increase in 2003 was driven by a
decrease in bad debt expense partially offset by a decrease in
gross profit discussed above. The decrease in bad debt expense
is reflective of the improved general economic environment
and reduced exposure in specific sectors, particularly the
Communications sector. (Also see pages 71 and 72 for an
additional discussion of Global Financing Receivable
Allowance for Doubtful Accounts.) The decrease in 2002
versus 2001 was due to increases in provisions for bad debt
reflective of the general economic environment as well as
specific client issues, such as the Communications sector,
partially offset by an increase in gross profit discussed previously.
The increase in return on equity from 2002 to 2003 was
due to higher earnings primarily associated with a decrease
in provisions for bad debt expense. The decrease in return
on equity from 2001 to 2002 was due to lower earnings asso-
ciated with an increased provision for bad debt expense.
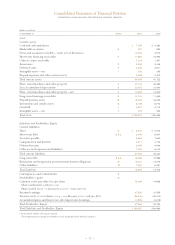
FINANCIAL CONDITION
Balance Sheet
(dollars in millions)
AT DECEMBER 31: 2003 2002
Cash $««««««813 $«««1,157
Net investment in sales-type leases 11,969 12,314
Equipment under operating leases:
External customers 1,707 1,922
Internal customers(a)(b) 1,873 1,701
Customer loans 10,413 9,621
Total customer financing assets 25,962 25,558
Commercial financing receivables 5,835 5,525
Intercompany financing
receivables(a)( b) 1,999 1,616
Other receivables 270 445
Other assets 1,037 941
Total financing assets $«35,916 $«35,242
Intercompany payables(a) $«««6,754 $«««5,383
Debt(c) 23,264 23,828
Other liabilities 2,546 2,556
Total financing liabilities 32,564 31,767
Total financing equity 3,352 3,475
Total financing liabilities and equity $«35,916 $«35,242
(a) Amounts eliminated for purposes of IBM’s consolidated results and therefore do not
appear on page 75.
(b)These assets, along with the other assets in this table, are leveraged using Global
Financing debt.
(c) Global Financing debt includes debt of the company and of the Global Financing units
that support the Global Financing business.
Sources and Uses of Funds
The primary use of funds in Global Financing is to originate
customer and commercial financing assets. Customer
financing assets for end users consist primarily of IBM hard-
ware, software and services, but also include non-IBM equip-
Management Discussion
INTERNATIONAL BUSINESS MACHINES CORPORATION AND SUBSIDIARY COMPANIES
70