IBM 2003 Annual Report Download - page 59
Download and view the complete annual report
Please find page 59 of the 2003 IBM annual report below. You can navigate through the pages in the report by either clicking on the pages listed below, or by using the keyword search tool below to find specific information within the annual report.-
 1
1 -
2
-
3
-
4
-
5
-
6
-
7
-
8
-
9
-
10
-
11
-
12
-
13
-
14
-
15
-
16
-
17
-
18
-
19
-
20
-
21
-
22
-
23
-
24
-
25
-
26
-
27
-
28
-
29
-
30
-
31
-
32
-
33
-
34
-
35
-
36
-
37
-
38
-
39
-
40
-
41
-
42
-
43
-
44
-
45
-
46
-
47
-
48
-
 49
49 -
 50
50 -
 51
51 -
 52
52 -
 53
53 -
 54
54 -
 55
55 -
 56
56 -
 57
57 -
 58
58 -
 59
59 -
 60
60 -
 61
61 -
 62
62 -
 63
63 -
 64
64 -
 65
65 -
 66
66 -
 67
67 -
 68
68 -
 69
69 -
70
-
71
-
72
-
73
-
74
-
75
-
76
-
77
-
78
-
79
-
80
-
81
-
82
-
83
-
84
-
85
-
86
-
87
-
88
-
89
-
90
-
91
-
92
-
93
-
94
-
95
-
96
-
97
-
98
-
99
-
100
-
101
-
102
-
103
-
104
-
105
-
106
-
107
-
108
-
109
-
110
-
111
-
112
-
113
-
114
-
115
-
116
-
117
-
118
-
119
-
120
-
121
-
122
-
123
-
124
-
125
-
126
-
127
-
128
 |
 |

57
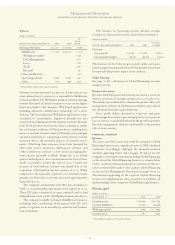
The increase in the Software gross profit dollars and gross
profit margin was primarily driven by the growth in Software
revenue and the positive impact from currency.
Global Financing
See page 70 for a discussion of Global Financing’s revenue
and gross profit.
Enterprise Investments
Revenue from Enterprise Investments increased 4.2 percent
(down 5.1 percent at constant currency) in 2003 versus 2002.
The decline was attributable to demand for product life-cycle
management software in the European market, especially in
the automotive and aerospace industries.
Gross profit dollars increased 12.9 percent and gross
profit margin increased 3.4 percentage points to 43.6 percent
in 2003 versus 2002 primarily driven by the growth in product
life-cycle management software attributable to the positive
effects from currency.
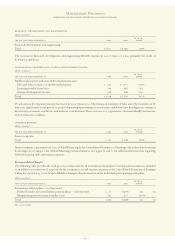
FINANCIAL POSITION
Dynamics
The assets and debt associated with the company’s Global
Financing business are a significant part of IBM’s financial
condition. Accordingly, although the financial position
amounts appearing below and on pages 58 and 59 are the
company’s consolidated amounts including Global Financing,
to the extent the Global Financing business is a major driver
of the consolidated financial position, reference in the nar-
rative section will be made to the separate Global Financing
section in this Management Discussion on pages 69 to 73.
The amounts appearing in the separate Global Financing
section are supplementary data presented to facilitate an
understanding of the company’s Global Financing business.
Working Capital
(dollars in millions)
AT DECEMBER 31: 2003 2002*
Current assets $«44,998 $«41,722
Current liabilities 37,900 34,220
Working capital $«««7,098 $«««7,502
Current ratio 1.19:1 1.22:1
*Reclassified to conform with 2003 presentation.
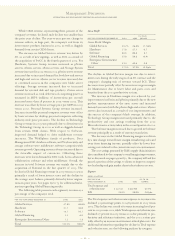
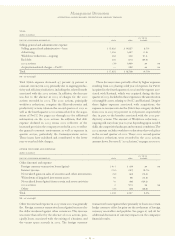
Software
(dollars in millions)
YR.
TO YR.
FOR THE YEAR ENDED DECEMBER 31: 2003 2002*CHANGE
Software Revenue: $«14,311 $«13,074 9.4%
Middleware $«11,242 $«10,117 11.1%
WebSphere family 11.8
Data Management 4.7
Lotus 0.9
Tivoli 12.0
Rational NA
Other middleware 5.5
Operating systems 2,450 2,307 6.2
Other 619 650 (4.7)
*Reclassified to conform with 2003 presentation.
Software revenue increased 9.4 percent (1.9 percent at con-
stant currency) in 2003 versus 2002, especially for Middleware
software products. The WebSphere family of software offerings
revenue increased as clients continue to focus on the higher
function products that integrate Web-based applications,
including advanced collaboration technology, on a user’s
desktop. The lower-function WebSphere application server
continued to commoditize. Improved demand was also
noted for Data Management DB2database software. Revenue
from Tivoli products increased as clients continue to realize
the on demand attributes of Tivoli products, enabling busi-
nesses to securely automate many of their processes and gain
operational efficiencies. Operating system software revenue
increased due to the favorable impacts of currency move-
ments. Offsetting these increases were lower demand for
DB2tools, Lotus advanced collaboration software and
Other middleware software. A new Lotus messaging plat-
form became generally available during the 2003 fourth
quarter and helped to drive momentum in the Lotus Notes
family of products toward the end of 2003. Overall, the
increase in total Software revenue was mainly due to the
acquisition of Rational in the first quarter of 2003. When
compared to the separately reported 2002 external revenue
amounts for Rational, its revenue increased approximately
6 percent in 2003.
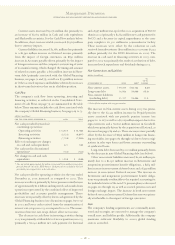
The company’s momentum with ISVs has continued to
build as 155 partnership agreements were signed in 2003.
These ISVs have committed to open standards and to lead
with platforms such as DB2, WebSphere, Linux and eServer.
The company is rapidly evolving its Middleware business,
including sales, marketing, development and ISV pro-
grams, to a greater focus on industry solutions and business
transformations.
Management Discussion
INTERNATIONAL BUSINESS MACHINES CORPORATION AND SUBSIDIARY COMPANIES
The increase in Operating system software revenue
correlates to the increases in the related eServer increases.
(dollars in millions)
YR. TO YR.
FOR THE YEAR ENDED DECEMBER 31: 2003 2002 CHANGE
Software:
Gross profit $«12,384 $«11,031 12.3%
Gross profit margin 86.5% 84.4% 2.1pts.