IBM 2003 Annual Report Download - page 114
Download and view the complete annual report
Please find page 114 of the 2003 IBM annual report below. You can navigate through the pages in the report by either clicking on the pages listed below, or by using the keyword search tool below to find specific information within the annual report.-
 1
1 -
2
-
3
-
4
-
5
-
6
-
7
-
8
-
9
-
10
-
11
-
12
-
13
-
14
-
15
-
16
-
17
-
18
-
19
-
20
-
21
-
22
-
23
-
24
-
25
-
26
-
27
-
28
-
29
-
30
-
31
-
32
-
33
-
34
-
35
-
36
-
37
-
38
-
39
-
40
-
41
-
42
-
43
-
44
-
45
-
46
-
47
-
48
-
49
-
50
-
51
-
52
-
53
-
54
-
55
-
56
-
57
-
58
-
59
-
60
-
61
-
62
-
63
-
64
-
65
-
66
-
67
-
68
-
69
-
70
-
71
-
72
-
73
-
74
-
75
-
76
-
77
-
78
-
79
-
80
-
81
-
82
-
83
-
84
-
85
-
86
-
87
-
88
-
89
-
90
-
91
-
92
-
93
-
94
-
95
-
96
-
97
-
98
-
99
-
100
-
101
-
102
-
103
-
 104
104 -
 105
105 -
 106
106 -
 107
107 -
 108
108 -
 109
109 -
 110
110 -
 111
111 -
 112
112 -
 113
113 -
 114
114 -
 115
115 -
 116
116 -
 117
117 -
 118
118 -
 119
119 -
 120
120 -
 121
121 -
 122
122 -
 123
123 -
 124
124 -
125
-
126
-
127
-
128
 |
 |

Notes to Consolidated Financial Statements
INTERNATIONAL BUSINESS MACHINES CORPORATION AND SUBSIDIARY COMPANIES
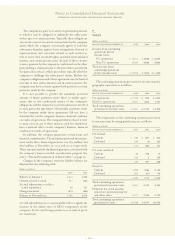
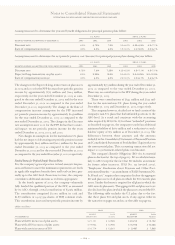
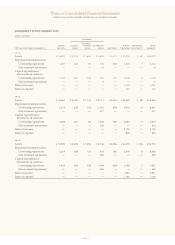
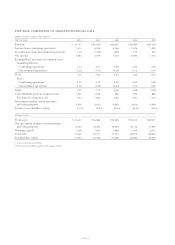
Cost/(Income) of Pension Plans
(dollars in millions)
U.S. PLANS*NON-U.S. PLANS
FOR THE YEAR ENDED DECEMBER 31: 2003 2002 2001 2003 2002 2001
Service cost $««««576 $««««650 $««««647 $««««537 $««««505 $««««429
Interest cost 2,518 2,591 2,560 1,477 1,270 1,214
Expected return on plan assets (3,703) (4,121) (4,202) (2,228) (2,132) (2,062)
Amortization of transition assets (144) (144) (143) (15) (12) (10)
Amortization of prior service cost 61 61 52 17 28 28
Recognized actuarial losses/(gains) ——— 101 33 (12)
Divestitures/settlement losses/(gains) —46 — —26 (12)
Net periodic pension income—U. S. Plan and
material non-U.S. Plans (692) *(917) *(1,086) *(111) (282) (425)
Cost of other defined benefit plans 132 124 141 100 58 54
Total net periodic pension income for all
defined benefit plans (560) (793) (945) (11) (224) (371)
Cost of defined contribution plans 333 315 313 265 178 162
Total retirement plan (income)/cost recognized
in the Consolidated Statement of Earnings $«««(227) $«««(478) $«««(632) $««««254 $«««««(46) $«««(209)
*Represents the qualified portion of the PPP.
See beginning of note W, “Retirement-Related Benefits,” on page 110 for the company’s total retirement-related benefits
cost/(income).
112
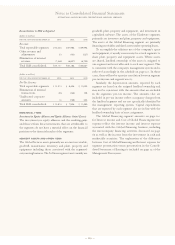
IBM Savings Plan – U.S. regular, full-time and part-time
employees are eligible to participate in the IBM Savings
Plan, which is a tax-qualified defined contribution plan
under section 401(k) of the Internal Revenue Code. The
company matches 50 percent of the employee’s contribution
up to the first 6 percent of the employee’s compensation. All
contributions, including the company match, are made in
cash, in accordance with the participants’ investment elections.
There are no minimum amounts that must be invested in
company stock, and there are no restrictions on transferring
amounts out of the company’s stock to another investment
choice. The total cost of all of the company’s U.S. defined
contribution plans was $333 million, $315 million and $313
million for the years ended December 31, 2003, 2002 and
2001, respectively.
U.S. Supplemental Executive Retention Plan – The company also
has a non-qualified U. S. Supplemental Executive Retention
Plan (SERP). The SERP, which is unfunded, provides defined
benefit pension benefits in addition to the PPP to eligible
executives based on average earnings, years of service and age
at retirement. Effective July 1, 1999, the company adopted the
SERP (which replaced the previous Supplemental Executive
Retirement Plan). Some participants of the prior SERP will
still be eligible for benefits under that plan, but will not be
eligible for the new plan. The total cost of this plan for the
years ended December 31, 2003, 2002 and 2001, was $25 mil-
lion, $18 million and $23 million, respectively. These amounts
are reflected in Cost of other defined benefit plans in the
table below. At December 31, 2003 and 2002, the benefit obli-
gation was $181 million and $130 million, respectively, and
the amounts included in Retirement and nonpension postre-
tirement benefit obligations in the Consolidated Statement
of Financial Position at December 31, 2003 and 2002, were
liabilities of $186 million and $165 million, respectively.
Non-U.S. Plans
Most subsidiaries and branches outside the U.S. have defined
benefit and/or defined contribution retirement plans that
cover substantially all regular employees, under which the
company deposits funds under various fiduciary-type
arrangements, purchases annuities under group contracts or
provides reserves. Benefits under the defined benefit plans are
typically based either on years of service and the employee’s
compensation, generally during a fixed number of years
immediately before retirement, or on annual credits. The
range of assumptions that are used for the non-U. S. defined
benefit plans reflects the different economic environments
within various countries. The total non-U.S. retirement plan
cost/(income) of these plans for the years ended December
31, 2003, 2002 and 2001, was $254 million, $(46) million and
$(209) million, respectively.