IBM 2003 Annual Report Download - page 67
Download and view the complete annual report
Please find page 67 of the 2003 IBM annual report below. You can navigate through the pages in the report by either clicking on the pages listed below, or by using the keyword search tool below to find specific information within the annual report.-
 1
1 -
2
-
3
-
4
-
5
-
6
-
7
-
8
-
9
-
10
-
11
-
12
-
13
-
14
-
15
-
16
-
17
-
18
-
19
-
20
-
21
-
22
-
23
-
24
-
25
-
26
-
27
-
28
-
29
-
30
-
31
-
32
-
33
-
34
-
35
-
36
-
37
-
38
-
39
-
40
-
41
-
42
-
43
-
44
-
45
-
46
-
47
-
48
-
49
-
50
-
51
-
52
-
53
-
54
-
55
-
56
-
 57
57 -
 58
58 -
 59
59 -
 60
60 -
 61
61 -
 62
62 -
 63
63 -
 64
64 -
 65
65 -
 66
66 -
 67
67 -
 68
68 -
 69
69 -
 70
70 -
 71
71 -
 72
72 -
 73
73 -
 74
74 -
 75
75 -
 76
76 -
 77
77 -
78
-
79
-
80
-
81
-
82
-
83
-
84
-
85
-
86
-
87
-
88
-
89
-
90
-
91
-
92
-
93
-
94
-
95
-
96
-
97
-
98
-
99
-
100
-
101
-
102
-
103
-
104
-
105
-
106
-
107
-
108
-
109
-
110
-
111
-
112
-
113
-
114
-
115
-
116
-
117
-
118
-
119
-
120
-
121
-
122
-
123
-
124
-
125
-
126
-
127
-
128
 |
 |

Purchase obligations include all commitments to purchase
goods or services of either a fixed or minimum quantity that
meet any of the following criteria: (1) they are noncancelable,
(2) the company would incur a penalty if the agreement was
cancelled, or (3) the company must make specified minimum
payments even if it does not take delivery of the contracted
products or services (“take-or-pay”). If the obligation to
purchase goods or services is noncancelable, the entire
value of the contract was included in the above table. If the
obligation is cancelable, but the company would incur a
penalty if cancelled, the dollar amount of the penalty was
included as a purchase obligation. Contracted minimum
amounts specified in take-or-pay contracts are also included
in the above table as they represent the portion of each con-
tract that is a firm commitment.
Events that could temporarily change the historical cash
flow dynamics discussed on page 64 include unexpected
adverse impacts from litigation or future pension funding
during periods of severe and prolonged downturns in the
capital markets. Whether any litigation has such an adverse
impact will depend on a number of variables, which are more
completely described on pages 101 and 102. With respect to
pension funding, the company is not quantifying such
impact because it is not possible to predict future timing or
direction of the capital markets. However, for 2004, if actual
returns on plan assets for the PPP were less than 5 percent,
the PPP’s accumulated benefit obligation (ABO) would be
greater than its Plan assets. As discussed on pages 110 to 115,
such a situation may result in a voluntary contribution of
cash or stock to the PPP or a charge to stockholders’ equity.
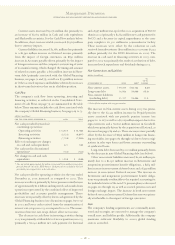
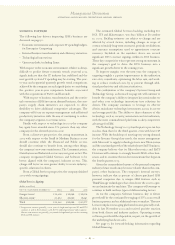
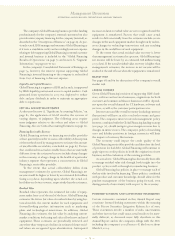
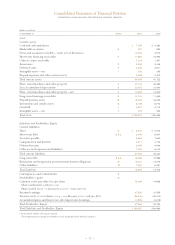
The following table depicts the company’s firm contrac-
tual commitments and must be reviewed within the context
of the discussion above. While these commitments may vary
from period to period and provide a view as to certain
unavoidable cash outflows, they represent a small picture of
the overall cash dynamics of the company in the table above.
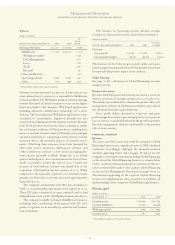
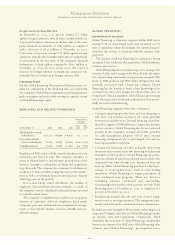
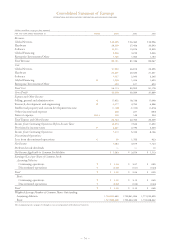
The table below represents the way in which management reviews its cash flow as described above.
(dollars in billions)
FOR THE YEAR ENDED DECEMBER 31: 1999 2000 2001 2002 2003
Net cash from operating activities (comprised of): $««9.0 $««8.8 $«14.0 $«13.8 $«14.6
Cash (from)/for Global Financing accounts receivable (1.7) (2.5) 2.0 3.3 1.9
Cash available for investment and for distribution
to shareholders 10.7 11.3 12.0 10.5 12.7
Net Global Financing receivables (2.3) (0.6) 0.9 0.2 (0.7)
Net capital expenditures (4.8) (4.3) (4.9) (4.6) (3.9)
Net divestitures/(acquisitions) 3.5 (0.3) (0.9) (2.0) (1.7)
Returns to shareholders (8.2) (7.6) (6.5) (5.2) (5.4)
Other 0.8 — 2.2 0.2 0.9
Net change in cash and cash equivalents $«(0.3) $«(1.5) $«««2.8 $««(0.9) $«««1.9
Management Discussion
INTERNATIONAL BUSINESS MACHINES CORPORATION AND SUBSIDIARY COMPANIES
65
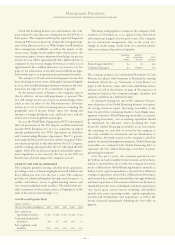
Contractual Obligations
(dollars in millions)
TOTAL
CONTRACTUAL
PAYMENT
PAYMENTS DUE IN
STREAM 2004 2005-06 2007-08 AFTER 2008
Long-term debt obligations $«19,343 $«4,061 $«««5,846 $«1,508 $«««7,928
Capital (Finance) lease obligations 58 11 27 6 14
Operating lease obligations 6,414 1,401 2,078 1,533 1,402
Purchase obligations 3,362 2,024 1,063 210 65
Other long-term liabilities:
Minimum pension funding (mandated)*1,212 220 564 428 —
Executive compensation 657 79 82 90 406
Environmental liabilities 243 29 32 28 154
Long-term termination benefits 2,627 487 396 260 1,484
Other 255 47 125 64 19
Total $«34,171 $«8,359 $«10,213 $«4,127 $«11,472
*These amounts represent future pension payments that are mandated by local regulations or statute. They are all associated with non-U.S. pension plans. The projected payments
beyond 2008 are not currently determinable. See note W, “Retirement-Related Benefits,” on pages 110 to 115 for additional information on the non-U.S. plans’ investment strategies
and expected contributions.