IBM 2003 Annual Report Download - page 58
Download and view the complete annual report
Please find page 58 of the 2003 IBM annual report below. You can navigate through the pages in the report by either clicking on the pages listed below, or by using the keyword search tool below to find specific information within the annual report.-
 1
1 -
2
-
3
-
4
-
5
-
6
-
7
-
8
-
9
-
10
-
11
-
12
-
13
-
14
-
15
-
16
-
17
-
18
-
19
-
20
-
21
-
22
-
23
-
24
-
25
-
26
-
27
-
28
-
29
-
30
-
31
-
32
-
33
-
34
-
35
-
36
-
37
-
38
-
39
-
40
-
41
-
42
-
43
-
44
-
45
-
46
-
47
-
 48
48 -
 49
49 -
 50
50 -
 51
51 -
 52
52 -
 53
53 -
 54
54 -
 55
55 -
 56
56 -
 57
57 -
 58
58 -
 59
59 -
 60
60 -
 61
61 -
 62
62 -
 63
63 -
 64
64 -
 65
65 -
 66
66 -
 67
67 -
 68
68 -
69
-
70
-
71
-
72
-
73
-
74
-
75
-
76
-
77
-
78
-
79
-
80
-
81
-
82
-
83
-
84
-
85
-
86
-
87
-
88
-
89
-
90
-
91
-
92
-
93
-
94
-
95
-
96
-
97
-
98
-
99
-
100
-
101
-
102
-
103
-
104
-
105
-
106
-
107
-
108
-
109
-
110
-
111
-
112
-
113
-
114
-
115
-
116
-
117
-
118
-
119
-
120
-
121
-
122
-
123
-
124
-
125
-
126
-
127
-
128
 |
 |

56
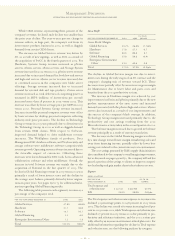
The Global Services gross profit dollars increased primarily
due to the corresponding increase in revenue. The gross
profit margin declined due to investment costs on the early
stages of an SO contract and the company’s changing mix
toward BCS. These decreases in the gross profit margin were
partially offset by the benefit from the 2002 productivity
actions, as well as an increase in the gross margin for Main-
tenance, due to lower labor costs, as a result of improved
product serviceability and increased automation, as well as
lower parts costs.
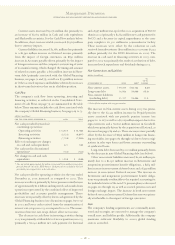
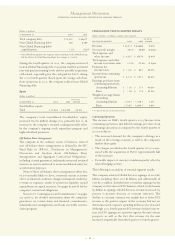
Hardware
(dollars in millions)
YR. TO YR.
PERCENT
FOR THE YEAR ENDED DECEMBER 31: 2003 2002 CHANGE
Hardware Revenue: $«28,260 $«27,630 2.3%
Systems Group $«14,002 $«12,646 10.7%
zSeries 7.4
iSeries 7.1
pSeries 12.5
xSeries 16.8
Storage Systems 9.8
Personal Systems Group 11,387 11,049 3.1
Personal Computers 3.5
Retail Store Solutions 9.3
Printer Systems (2.7)
Technology Group 2,871 3,935 (27.0)
Microelectronics (28.6)
Engineering &
Technology Services 65.6
Other (41.2)
Systems Group revenue increased 10.7 percent (3.3 percent
at constant currency) in 2003 versus 2002 driven by xSeries
server products due to growth in sales of high-volume
servers supported by strong growth in blades. The company
is now the industry leader in blade servers and just recently
announced the industry’s most powerful 4-way blade solution
at close to one-fourth the size of the competitors’ offerings. A
blade is an independent server with its own processors,
memory, storage, network controllers, operating system and
applications. Blade servers slide into the bays in a single
chassis, sharing power, fans, floppy drives, switches and
ports with other blade servers, thereby reducing the cost of
ownership by making it easier for clients to maintain the
machines. The pSeries server revenues increased due to
strong demand for the 64-bit POWER systems across both
the low-end and high-end server offerings. The company
expects to gain market share in both the xSeries and pSeries
server businesses.
Revenue from the zSeries servers increased. The total
delivery of zSeries computing power as measured in MIPS
increased more than 28 percent in 2003 as compared to
2002. This increase was offset by lower average price per
MIPS in 2003 versus 2002. The zSeries servers are often an
integral part of clients’ restructuring into an on demand
environment. Revenue from the iSeries servers increased in
all four quarters of 2003 when compared to 2002. An impor-
tant competitive differentiator for this platform is its ability
to consolidate and integrate heterogeneous workloads.
Storage Systems revenue increased due to growth in external
disk and tape products.
Personal Systems Group revenue increased 3.1 percent
(down 2.5 percent at constant currency) in 2003 versus 2002.
Revenue from mobile personal computers increased due to
strong demand and was offset by lower desktop personal
computer revenue. The decreased desktop revenue prima-
rily reflects the fact that increased volume gains were not
enough to offset a reduction in price due to decreasing com-
modity costs.
Technology Group revenue declined 27.0 percent
(27.5 percent at constant currency) in 2003 versus 2002
driven by actions taken in 2002 to refocus and redirect its
Microelectronics business to the high-end foundry, ASICs
and standard products, while creating a new technology
services business. These actions included the divestiture of
multiple non-core businesses. See pages 105 and 106 for addi-
tional information. There was also sluggish demand from
certain OEM clients that contributed to this decline. The
Technology Group’s advanced technologies provide the
Systems Group with a competitive advantage in performance
and cost, drivers for the Systems Group’s strong performance.
See page 118 for a discussion of the first quarter 2004 com-
bination of the Systems Group and the Technology Group.
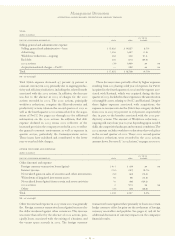
Management Discussion
INTERNATIONAL BUSINESS MACHINES CORPORATION AND SUBSIDIARY COMPANIES
(dollars in millions)
YR. TO YR.
FOR THE YEAR ENDED DECEMBER 31: 2003 2002 CHANGE
Hardware:
Gross profit $«8,136 $«7,399 10.0%
Gross profit margin 28.8% 26.8% 2.0 pts.
Hardware gross profit dollars and gross profit margin
increased in 2003 versus 2002. The increases were primarily
driven by increases in Technology Group and Systems
Group, and a more favorable mix of revenue toward the
Systems Group, which has a higher gross profit margin than
the other Hardware groups. The increase in Technology
Group was primarily due to the productivity and cost savings
resulting from the 2002 Microelectronics actions taken in
the second quarter of 2002. The Systems Group gross margin
increases were due to improvements across most products,
as a result of improved component costs partly attributable
to the company’s supply chain initiatives and reduced inven-
tory losses.