IBM 2003 Annual Report Download - page 124
Download and view the complete annual report
Please find page 124 of the 2003 IBM annual report below. You can navigate through the pages in the report by either clicking on the pages listed below, or by using the keyword search tool below to find specific information within the annual report.-
 1
1 -
2
-
3
-
4
-
5
-
6
-
7
-
8
-
9
-
10
-
11
-
12
-
13
-
14
-
15
-
16
-
17
-
18
-
19
-
20
-
21
-
22
-
23
-
24
-
25
-
26
-
27
-
28
-
29
-
30
-
31
-
32
-
33
-
34
-
35
-
36
-
37
-
38
-
39
-
40
-
41
-
42
-
43
-
44
-
45
-
46
-
47
-
48
-
49
-
50
-
51
-
52
-
53
-
54
-
55
-
56
-
57
-
58
-
59
-
60
-
61
-
62
-
63
-
64
-
65
-
66
-
67
-
68
-
69
-
70
-
71
-
72
-
73
-
74
-
75
-
76
-
77
-
78
-
79
-
80
-
81
-
82
-
83
-
84
-
85
-
86
-
87
-
88
-
89
-
90
-
91
-
92
-
93
-
94
-
95
-
96
-
97
-
98
-
99
-
100
-
101
-
102
-
103
-
104
-
105
-
106
-
107
-
108
-
109
-
110
-
111
-
112
-
113
-
 114
114 -
 115
115 -
 116
116 -
 117
117 -
 118
118 -
 119
119 -
 120
120 -
 121
121 -
 122
122 -
 123
123 -
 124
124 -
 125
125 -
 126
126 -
 127
127 -
 128
128
 |
 |

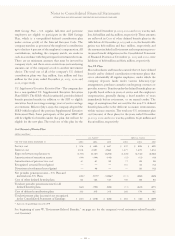
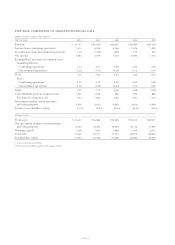
five-year comparison of selected financial data
(dollars in millions except per share amounts)
FOR THE YEAR: 2003 2002 2001 2000 1999
Revenue $«««89,131 $«81,186 $«83,067 $«85,089 $«83,334
Income from continuing operations 7,613 5,334 8,146 7,874 7,359
(Loss)/income from discontinued operations (30) (1,755) (423) 219 353
Net income 7,583 3,579 7,723 8,093 7,712
Earnings/(loss) per share of common stock:
Assuming dilution:
Continuing operations 4.34 3.07 4.59 4.32 3.93
Discontinued operations (0.02) (1.01) (0.24) 0.12 0.19
Total 4.32 2.06 4.35 4.44 4.12
Basic:
Continuing operations 4.42 3.13 4.69 4.45 4.06
Discontinued operations (0.02) (1.03) (0.24) 0.12 0.20
Total 4.40 2.10 4.45 4.58*4.25*
Cash dividends paid on common stock 1,085 1,005 956 909 859
Per share of common stock 0.63 0.59 0.55 0.51 0.47
Investment in plant, rental machines
and other property 4,398 5,022 5,660 5,616 5,959
Return on stockholders’ equity 29.9% 15.5% 35.3% 40.0% 39.1%
AT END OF YEAR:
Total assets $«104,457 $«96,484 $«90,303 $«90,412 $«89,571
Net investment in plant, rental machines
and other property 14,689 14,440 16,504 16,714 17,590
Working capital** 7,098 7,502 7,484 7,474 3,577
Total debt 23,632 26,017 27,151 28,576 28,354
Stockholders’ equity 27,864 22,782 23,448 20,550 20,426
*Does not total due to rounding.
** Prior years reclassified to conform with 2003 presentation.
122