IBM 2003 Annual Report Download - page 55
Download and view the complete annual report
Please find page 55 of the 2003 IBM annual report below. You can navigate through the pages in the report by either clicking on the pages listed below, or by using the keyword search tool below to find specific information within the annual report.-
 1
1 -
2
-
3
-
4
-
5
-
6
-
7
-
8
-
9
-
10
-
11
-
12
-
13
-
14
-
15
-
16
-
17
-
18
-
19
-
20
-
21
-
22
-
23
-
24
-
25
-
26
-
27
-
28
-
29
-
30
-
31
-
32
-
33
-
34
-
35
-
36
-
37
-
38
-
39
-
40
-
41
-
42
-
43
-
44
-
 45
45 -
 46
46 -
 47
47 -
 48
48 -
 49
49 -
 50
50 -
 51
51 -
 52
52 -
 53
53 -
 54
54 -
 55
55 -
 56
56 -
 57
57 -
 58
58 -
 59
59 -
 60
60 -
 61
61 -
 62
62 -
 63
63 -
 64
64 -
 65
65 -
66
-
67
-
68
-
69
-
70
-
71
-
72
-
73
-
74
-
75
-
76
-
77
-
78
-
79
-
80
-
81
-
82
-
83
-
84
-
85
-
86
-
87
-
88
-
89
-
90
-
91
-
92
-
93
-
94
-
95
-
96
-
97
-
98
-
99
-
100
-
101
-
102
-
103
-
104
-
105
-
106
-
107
-
108
-
109
-
110
-
111
-
112
-
113
-
114
-
115
-
116
-
117
-
118
-
119
-
120
-
121
-
122
-
123
-
124
-
125
-
126
-
127
-
128
 |
 |

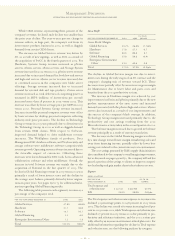
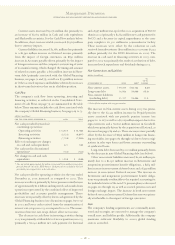
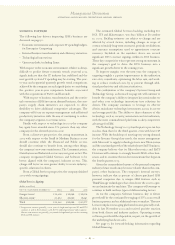
sg&a
(dollars in millions)
YR. TO YR.
FOR THE YEAR ENDED DECEMBER 31: 2003 2002 CHANGE
Selling, general and administrative expense:
Selling, general and administrative—base $«15,826 $«14,557 8.7%
Advertising 1,406 1,427 (1.5)
Wo rkforce reductions—ongoing 454 300 51.3
Bad debt 205 673 (69.5)
2002 actions (39) 1,489 NM NM
Acquisition-related charges—PwCC —292 NM NM
Total $«17,852 $«18,738 (4.7) %
NM—not meaningful
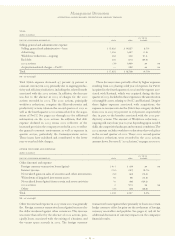
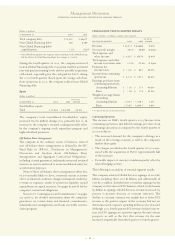
other (income) and expense
(dollars in millions)
YR. TO YR.
FOR THE YEAR ENDED DECEMBER 31: 2003 2002 CHANGE
Other (income) and expense:
Foreign currency transaction losses/(gains) $«411 $÷(39) NM NM
Interest income (152) (127) 19.7%
Net realized gains on sales of securities and other investments (54) (63) (14.3)
Writedowns of impaired investment assets 50 58 (13.8)
Net realized losses/(gains) from certain real estate activities 16 (66) (124.2)
2002 actions 2513 NM NM
Other (35) (49) (28.6)
Total $«238 $«227 5.0%
NM—not meaningful
Management Discussion
INTERNATIONAL BUSINESS MACHINES CORPORATION AND SUBSIDIARY COMPANIES
53
Total SG&A expense decreased 4.7 percent (9 percent at
constant currency) in 2003 primarily due to ongoing produc-
tivity and efficiency initiatives, including the related benefit
associated with the 2002 actions. In addition, the decrease
was due to the absence in 2003 of charges for the 2002
actions recorded in 2002. The 2002 actions, principally
workforce reductions, comprise the Microelectronics and
productivity actions taken in the second quarter of 2002 as
well as the fourth quarter 2002 actions related to the acqui-
sition of PwCC. See pages 105 through 107 for additional
information on the 2002 actions. In addition, Bad debt
expense declined in 2003 versus 2002 reflective of the
increased provision the company recorded in 2002 to reflect
the general economic environment as well as exposure in
specific sectors, particularly the Communications sector.
These issues have stabilized and contributed to the lower
year-to-year bad debt charges.
These decreases were partially offset by higher expenses
resulting from 2003 having a full year of expenses for PwCC
(acquired in the fourth quarter of 2002) and the expense asso-
ciated with Rational, which was acquired during the first
quarter of 2003. Included in these expenses is the amortization
of intangible assets relating to PwCC and Rational. Despite
these higher expenses associated with acquisitions, the
expense-to-revenue ratio for the SG&A-base category declined
from 2002 to 2003 (17.9 percent to 17.8 percent, respectively)
due, in part, to the benefits associated with the 2002 pro-
ductivity actions. The amount of Workforce reductions—
ongoing will vary from year to year depending upon needed
skills, the competitive landscape and economic conditions. The
2002 amount excludes workforce reductions that took place
in the second quarter of 2002. These 2002 second-quarter
workforce reductions were recorded in the 2002 actions
amount above. See note S, “2002 Actions,” on pages 105 to 107.
Other (income) and expense in 2003 versus 2002 was generally
flat. Foreign currency transaction losses/(gains) increased as
the dollar weakened against other currencies. This increase
was more than offset by the absence of 2002 actions, prin-
cipally losses associated with the exiting of a business and
the vacant space accruals in 2002. The foreign currency
transaction losses/ (gains) relate primarily to losses on certain
hedge contracts offset by gains on the settlement of foreign
currency receivables and payables. See pages 67 and 68 for
additional discussion of currency impacts on the company’s
financial results.