IBM 2003 Annual Report Download - page 7
Download and view the complete annual report
Please find page 7 of the 2003 IBM annual report below. You can navigate through the pages in the report by either clicking on the pages listed below, or by using the keyword search tool below to find specific information within the annual report.-
 1
1 -
 2
2 -
 3
3 -
 4
4 -
 5
5 -
 6
6 -
 7
7 -
 8
8 -
 9
9 -
 10
10 -
 11
11 -
 12
12 -
 13
13 -
 14
14 -
 15
15 -
 16
16 -
 17
17 -
 18
18 -
19
-
20
-
21
-
22
-
23
-
24
-
25
-
26
-
27
-
28
-
29
-
30
-
31
-
32
-
33
-
34
-
35
-
36
-
37
-
38
-
39
-
40
-
41
-
42
-
43
-
44
-
45
-
46
-
47
-
48
-
49
-
50
-
51
-
52
-
53
-
54
-
55
-
56
-
57
-
58
-
59
-
60
-
61
-
62
-
63
-
64
-
65
-
66
-
67
-
68
-
69
-
70
-
71
-
72
-
73
-
74
-
75
-
76
-
77
-
78
-
79
-
80
-
81
-
82
-
83
-
84
-
85
-
86
-
87
-
88
-
89
-
90
-
91
-
92
-
93
-
94
-
95
-
96
-
97
-
98
-
99
-
100
-
101
-
102
-
103
-
104
-
105
-
106
-
107
-
108
-
109
-
110
-
111
-
112
-
113
-
114
-
115
-
116
-
117
-
118
-
119
-
120
-
121
-
122
-
123
-
124
-
125
-
126
-
127
-
128
 |
 |
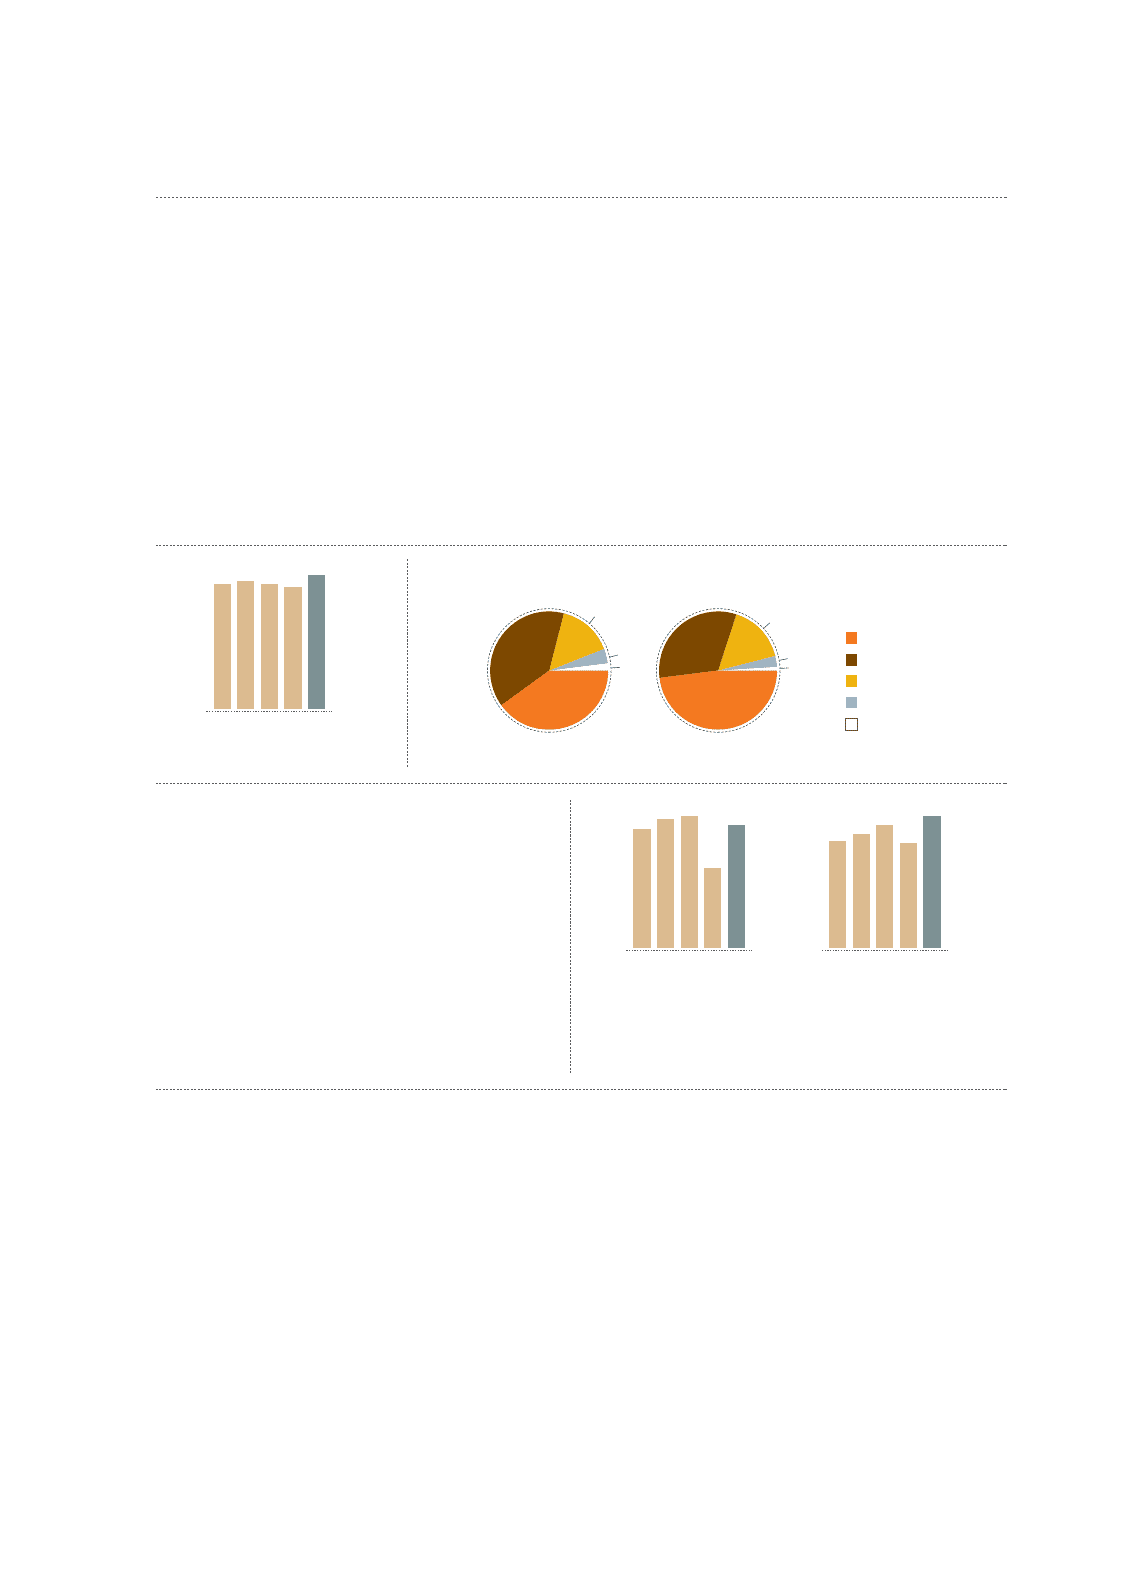
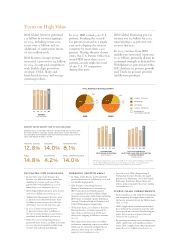
$7. 4
99
$7.9
00
$8.1
01
$5.3
02
$7. 6
03
$10.7
99
$11.3
00
$12.0
01
$10.5
02
$12.7
03
INCOME FROM
CONTINUING OPERATIONS
($ IN BILLIONS)
CASH AVAILABLE FOR
INVESTMENT AND FOR DISTRIBUTION
TO SHAREHOLDERS*
($ IN BILLIONS)
TOTAL REVENUE BY BUSINESS SEGMENT
40%
15%
4%
2%
39% 48%
32%
16%
3%
1%
REVENUES IN ALL SIX OF IBM’S INDUSTRY SECTORS GREW FOR THE FULL YEAR,
WITH THE FINANCIAL SERVICES SECTOR, INDUSTRIAL SECTOR AND PUBLIC
SECTOR AMONG THE STRONGEST, AND WITH CONTINUED GOOD RESULTS IN THE
SMALL AND MEDIUM BUSINESS SECTOR.
IBM Global Services generated
billion in services signings
in , including seven con-
tracts over billion and an
additional contracts in excess
of million each.
IBM Systems Group revenue
increased percent to billion
in .It outpaced competitors
with double-digit growth in
strategic UNIX, blade and
Intel-based servers, and storage
systems products.
In , IBM earned , U.S.
patents, breaking the record
for patents received in a single
year and eclipsing the nearest
company by more than ,
patents. During the past eleven
years, the U.S. Patent Office has
issued IBM more than ,
patents
—
nearly triple the total
of any U.S. IT competitor
during this time.
IBM Global Financing pre-tax
income was . billion for ,
representing a percent year-
to-year increase.
In , revenue from IBM
middleware increased percent
to billion, primarily driven by
continued strength in demand for
WebSphere ( percent growth),
DB2 database ( percent growth)
and Tivoli ( percent growth)
middleware products.
Focus on High Value
99 00 01 02
$83.3
$85.1
$83.1
$81.2
$89.1
03
REVENUE
($ IN BILLIONS)
2003
1999
GLOBAL SERVICES
HARDWARE
SOFTWARE
GLOBAL FINANCING
ENTERPRISE
INVESTMENTS/OTHER
FINANCIAL SERVICES
12.8%14.0%8.1%
14.8%4.2%14.0%
PUBLIC
INDUSTRIAL
DISTRIBUTION
COMMUNICATIONS
SMALL & MEDIUM BUSINESS
INDUSTRY SECTOR GROWTH YEAR TO YEAR (2002-2003)
incubated new businesses
•In just three years, Life Sciences has
become a $1 billion business, more than
doubling its revenue each year. It has
grown from two employees in 2001 to
more than 1,000 employees in 2003.
•IBM’s Digital Media business grew 60 per-
cent to $1.7 billion in revenue in 2003.
•Application Management Services grew
30 percent and contributed more than
$1 billion in new revenue since the line
of business was created two years ago.
•In 2003, Linux revenue grew over
50 percent to more than $2 billion, as
the rate of related software and services
combined nearly doubled year to year.
•IBM’s Pervasive Computing business
generated more than $2.4 billion in revenue
in 2003, 36 percent growth mainly from
services and software installations.
•In its first year, IBM’s Engineering &
Technology Services business designed
products for Medtronic, New York Stock
Exchange, Raytheon, Mayo Clinic and
others, generating more than $160 million
in revenue in 2003.
supply chain improvements
•By the end of 2003, the work of transforming
and integrating the supply chain resulted in
the lowest inventory levels for IBM in more
than 20 years.
•IBM’s supply chain transformation efforts
have reduced the amount of time the sales
force spends on activities like checking on
order status, proposal generation and
contracts by 20 percent.
•By speeding inventory turns and improving
client collections and supplier payment
terms, IBM’s supply chain efforts generated
more than $700 million in cash in 2003.
emerging growth areas
•In China, India, Russia and Brazil, IBM
generated revenue of $3 billion in 2003 and
saw double-digit growth.
•IBM Business Consulting Services’
Business Transformation Outsourcing
(BTO) unit generated fourth-quarter
2003 signings of nearly $3 billion. Major
contracts are in place with clients including
BP, Procter & Gamble, Sprint, Raytheon
Aircraft, Dresdner Bank of Germany, and
United Technologies Corporation.
•With more than 2,000 clients, e-business
Hosting Services revenue increased by
more than 20 percent each of the past
three years, topping $1 billion in revenue
in 2003.
•IBM clients have more than $10 billion
in dormant computing capacity installed,
which can be turned on and paid for on
demand. More than $500 million in
capacity was turned on in 2003.
* This represents management’s view of cash available for investment and for distribution to shareholders.
See the company’s Management Discussion section on pages 64 and 65 for a reconciliation of these
amounts to GAAP net cash from operating activities and basis for its presentation.