IBM 2003 Annual Report Download - page 46
Download and view the complete annual report
Please find page 46 of the 2003 IBM annual report below. You can navigate through the pages in the report by either clicking on the pages listed below, or by using the keyword search tool below to find specific information within the annual report.-
 1
1 -
2
-
3
-
4
-
5
-
6
-
7
-
8
-
9
-
10
-
11
-
12
-
13
-
14
-
15
-
16
-
17
-
18
-
19
-
20
-
21
-
22
-
23
-
24
-
25
-
26
-
27
-
28
-
29
-
30
-
31
-
32
-
33
-
34
-
35
-
 36
36 -
 37
37 -
 38
38 -
 39
39 -
 40
40 -
 41
41 -
 42
42 -
 43
43 -
 44
44 -
 45
45 -
 46
46 -
 47
47 -
 48
48 -
 49
49 -
 50
50 -
 51
51 -
 52
52 -
 53
53 -
 54
54 -
 55
55 -
 56
56 -
57
-
58
-
59
-
60
-
61
-
62
-
63
-
64
-
65
-
66
-
67
-
68
-
69
-
70
-
71
-
72
-
73
-
74
-
75
-
76
-
77
-
78
-
79
-
80
-
81
-
82
-
83
-
84
-
85
-
86
-
87
-
88
-
89
-
90
-
91
-
92
-
93
-
94
-
95
-
96
-
97
-
98
-
99
-
100
-
101
-
102
-
103
-
104
-
105
-
106
-
107
-
108
-
109
-
110
-
111
-
112
-
113
-
114
-
115
-
116
-
117
-
118
-
119
-
120
-
121
-
122
-
123
-
124
-
125
-
126
-
127
-
128
 |
 |

•The selected reference to constant currency in the
Management Discussion is made so that the financial
results can be viewed without the impacts of changing for-
eign currency exchange rates and therefore facilitates a
comparative view of business growth.
Discontinued Operations
On December 31, 2002, the company sold its HDD business
to Hitachi, Ltd. (Hitachi). The HDD business was accounted
for as a discontinued operation under generally accepted
accounting principles (GAAP). This means that 2002 and 2001
income statement and cash flow information were reformatted
to separate the divested business from the company’s con-
tinuing operations. This presentation is required by GAAP
and facilitates historical and future trend analysis of IBM’s
continuing operations. On page 92, the company discusses
this transaction and the accounting for the divestiture.
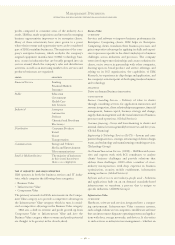
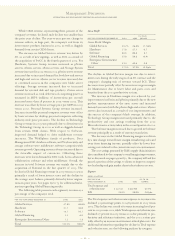
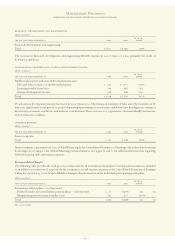
management discussion snapshot
(dollars and shares in millions except per share amounts)
YR. TO YR.
PERCENT/
MARGIN
FOR THE YEAR ENDED DECEMBER 31: 2003 2002 CHANGE
Revenue $«««89,131 $«81,186 9.8% *
Gross profit margin 37.0% 37.3% (0.3) pts.
Total expense and
other income $«««22,144 $«22,760 (2.7) %
Total expense and
other income to
revenue ratio 24.8% 28.0% (3.2) pts.
Provision for
income taxes $«««««3,261 $«««2,190 48.9%
Income from
continuing operations $«««««7,613 $«««5,334 42.7%
Earnings per share
from continuing
operations:
Assuming dilution $«««««««4.34 $«««««3.07 41.4%
Basic $«««««««4.42 $«««««3.13 41.2%
Weighted-average
shares outstanding:
Assuming dilution 1,756.1 1,730.9 1.5%
Basic 1,721.6 «1,703.2 1.1%
Assets** $«104,457 $«96,484 8.3%
Liabilities** $«««76,593 $«73,702 3.9%
Equity** $«««27,864 $«22,782 22.3%
*2.8 percent at constant currency
** at December 31
CONTINUING OPERATIONS
The increase in IBM’s 2003 Income from continuing oper-
ations and diluted earnings per share from continuing
operations as compared to 2002 was due to:
•The results of the company’s productivity and efficiency
initiatives, including the benefits from the 2002
Microelectronics and productivity actions
•Stronger demand associated with the improving economy
(especially during the fourth quarter) and continued mar-
ket share gains
•The charges recorded in 2002 for the 2002 actions
•Favorable impact of currency translation, partly offset by
related hedging activities
The increase in revenue in 2003 as compared to 2002 was
due to:
•Stronger demand associated with the improving economy
(especially during the fourth quarter) and continued market
share gains
•The impact of the fourth quarter 2002 acquisition of
PwCC and the first quarter 2003 acquisition of Rational,
partially offset by decreases in revenue due to Technology
Group divestitures
•The favorable impact from currency translation
With regard to the way that management reviews the busi-
ness, as-reported and constant currency revenue trends were
all positive for most of the company’s segments, geographies
and industry sectors. See page 51 for the summary trend rates
on an as-reported and constant currency basis, as well as such
information for each segment on pages 55 to 57.
Gross profit margins remained relatively flat. Increases in
Hardware and Software margins resulting from the ongoing
benefits from the company’s integrated supply chain initiatives
and favorable currency translation were offset by decreases
in Global Services margins driven primarily by investment
costs on the early stages of a Strategic Outsourcing (SO)
contract and the company’s changing mix of revenue toward
Business Consulting Services (BCS).
As discussed above, there were several charges in 2002
that impacted the year-to-year expense comparison. These
items contributed 2.8 points of the improvement in the Total
expense and other income-to-revenue ratio. The remaining
improvement was primarily due to the results of productivity
and efficiency initiatives partially offset by an increase in
retirement-related plans cost.
Management Discussion
INTERNATIONAL BUSINESS MACHINES CORPORATION AND SUBSIDIARY COMPANIES
44