IBM 2003 Annual Report Download - page 123
Download and view the complete annual report
Please find page 123 of the 2003 IBM annual report below. You can navigate through the pages in the report by either clicking on the pages listed below, or by using the keyword search tool below to find specific information within the annual report.-
 1
1 -
2
-
3
-
4
-
5
-
6
-
7
-
8
-
9
-
10
-
11
-
12
-
13
-
14
-
15
-
16
-
17
-
18
-
19
-
20
-
21
-
22
-
23
-
24
-
25
-
26
-
27
-
28
-
29
-
30
-
31
-
32
-
33
-
34
-
35
-
36
-
37
-
38
-
39
-
40
-
41
-
42
-
43
-
44
-
45
-
46
-
47
-
48
-
49
-
50
-
51
-
52
-
53
-
54
-
55
-
56
-
57
-
58
-
59
-
60
-
61
-
62
-
63
-
64
-
65
-
66
-
67
-
68
-
69
-
70
-
71
-
72
-
73
-
74
-
75
-
76
-
77
-
78
-
79
-
80
-
81
-
82
-
83
-
84
-
85
-
86
-
87
-
88
-
89
-
90
-
91
-
92
-
93
-
94
-
95
-
96
-
97
-
98
-
99
-
100
-
101
-
102
-
103
-
104
-
105
-
106
-
107
-
108
-
109
-
110
-
111
-
112
-
 113
113 -
 114
114 -
 115
115 -
 116
116 -
 117
117 -
 118
118 -
 119
119 -
 120
120 -
 121
121 -
 122
122 -
 123
123 -
 124
124 -
 125
125 -
 126
126 -
 127
127 -
 128
128
 |
 |

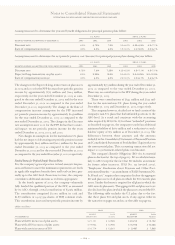
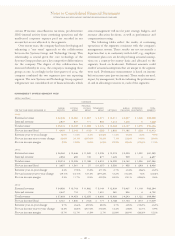
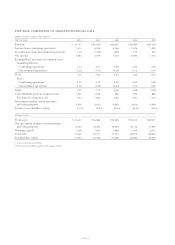
GEOGRAPHIC INFORMATION
(dollars in millions)
REVENUE*LONG-LIVED ASSETS**+
FOR THE YEAR ENDED DECEMBER 31: 2003 2002 2001 2003 2002++ 2001++
United States $«33,762 $«32,759 $«34,233 $«29,594 $«27,819 $«22,658
Japan 11,694 10,939 11,512 2,738 2,814 4,034
Other countries 43,675 37,488 37,322 16,373 13,027 11,560
Total $«89,131 $«81,186 $«83,067 $«48,705 $«43,660 $«38,252
*Revenues are attributed to countries based on location of client and are for continuing operations.
** Includes all non-current assets except non-current financial instruments and deferred tax assets.
+At December 31.
++Reclassified to conform with 2003 presentation.
121
Notes to Consolidated Financial Statements
INTERNATIONAL BUSINESS MACHINES CORPORATION AND SUBSIDIARY COMPANIES
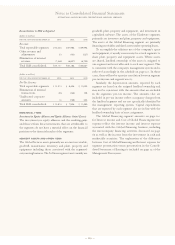
Reconciliations to IBM as Reported
(dollars in millions)
AT DECEMBER 31: 2003 2002 2001
Assets:
Total reportable segments $«««68,347 $«63,824 $«64,720
Elimination of internal
transactions (5,613) (5,061) (4,884)
Unallocated amounts:
Cash and marketable
securities 6,523 4,568 5,313
Notes and accounts
receivable 3,334 3,553 2,810
Deferred tax assets 6,486 6,631 4,624
Plant, other property
and equipment 3,380 3,239 3,260
Pension assets 18,416 15,996 11,398
Other 3,584 3,734 3,062
Total IBM consolidated $«104,457 $«96,484 $«90,303
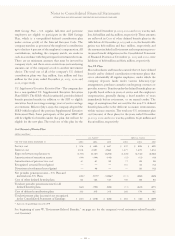
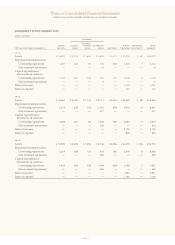
REVENUE BY CLASSES OF SIMILAR PRODUCTS OR SERVICES
For the Personal Systems Group, Software and Global
Financing segments, the segment data on page 118 represents
the revenue contributions from the products that are con-
tained in the segments and that are basically similar in
nature. The following table provides external revenue for
similar classes of products within the Technology Group,
Systems Group, Global Services and Enterprise Investments
segments. The Technology Group segment’s OEM hardware
comprises revenue primarily from the sale of semiconductors
and display devices. Technology services comprise the
Technology Group’s circuit design business for its OEM
clients, as well as the component design services, strategic
outsourcing of client’s design team work, and technology and
manufacturing consulting services associated with the
Engineering & Technology Services Division. The Systems
Group segment’s storage comprises revenue from the
Enterprise Storage Server, other disk storage products and
tape subsystems. Enterprise Investments software revenue is
primarily from product life-cycle management products. The
following table is presented on a continuing operations basis.
(dollars in millions)
CONSOLIDATED
FOR THE YEAR ENDED DECEMBER 31: 2003 2002 2001
Technology Group:
OEM $«««2,546 $«««3,612 $«««4,805
Technology services 325 323 344
Systems Group:
Servers $«11,148 $«10,047 $«10,947
Storage 2,849 2,581 2,755
Networking products 518 41
Global Services:
Services $«37,178 $«31,290 $«29,953
Maintenance 5,457 5,070 5,003
Enterprise Investments:
Software $««««««981 $««««««916 $««««««913
Hardware 72 95 181
Others 12 11 24
MAJOR CLIENTS
No single client represents 10 percent or more of the company’s
total revenue.