IBM 2003 Annual Report Download - page 95
Download and view the complete annual report
Please find page 95 of the 2003 IBM annual report below. You can navigate through the pages in the report by either clicking on the pages listed below, or by using the keyword search tool below to find specific information within the annual report.-
 1
1 -
2
-
3
-
4
-
5
-
6
-
7
-
8
-
9
-
10
-
11
-
12
-
13
-
14
-
15
-
16
-
17
-
18
-
19
-
20
-
21
-
22
-
23
-
24
-
25
-
26
-
27
-
28
-
29
-
30
-
31
-
32
-
33
-
34
-
35
-
36
-
37
-
38
-
39
-
40
-
41
-
42
-
43
-
44
-
45
-
46
-
47
-
48
-
49
-
50
-
51
-
52
-
53
-
54
-
55
-
56
-
57
-
58
-
59
-
60
-
61
-
62
-
63
-
64
-
65
-
66
-
67
-
68
-
69
-
70
-
71
-
72
-
73
-
74
-
75
-
76
-
77
-
78
-
79
-
80
-
81
-
82
-
83
-
84
-
 85
85 -
 86
86 -
 87
87 -
 88
88 -
 89
89 -
 90
90 -
 91
91 -
 92
92 -
 93
93 -
 94
94 -
 95
95 -
 96
96 -
 97
97 -
 98
98 -
 99
99 -
 100
100 -
 101
101 -
 102
102 -
 103
103 -
 104
104 -
 105
105 -
106
-
107
-
108
-
109
-
110
-
111
-
112
-
113
-
114
-
115
-
116
-
117
-
118
-
119
-
120
-
121
-
122
-
123
-
124
-
125
-
126
-
127
-
128
 |
 |

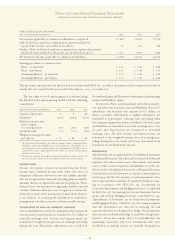
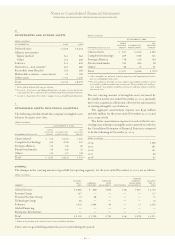
(dollars in millions)
FAIR VALUE
AT DECEMBER 31: 2003 2002
Marketable securities—current:
Time deposits and other obligations $«357 $«593
Marketable securities—non-current:**
Time deposits and other obligations $«««36 $«172
Non-U.S. government securities and
other fixed-term obligations 23 20
Total $«««59 $«192
Non-equity method alliance
investments** $«234 $«249
*Gross unrealized gains (before taxes) on marketable securities and alliance investments
were $11 million and $9 million at December 31, 2003 and 2002, respectively. Gross
unrealized losses (before taxes) on marketable securities and alliance investments were
$2 million and $10 million at December 31, 2003 and 2002, respectively. See note N,
“Stockholders’ Equity Activity,” on pages 100 and 101 for net change in unrealized
gains and losses on marketable securities and certain other information regarding
unrealized losses.
** Included within Investments and sundry assets in the Consolidated Statement of
Financial Position. See note H, “Investments and Sundry Assets,” on page 94.
E
inventories
(dollars in millions)
AT DECEMBER 31: 2003 2002
Finished goods $««««992 $««««960
Work in process and raw materials 1,950 2,188
Total $«2,942 $«3,148
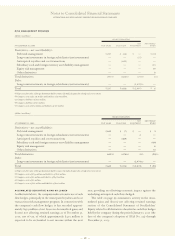
F
financing receivables
(dollars in millions)
AT DECEMBER 31: 2003 2002
Short-term:
Net investment in sales-type leases $«««5,940 $«««5,779
Commercial financing receivables 5,653 4,972
Customer loans receivable 5,235 4,462
Installment payment receivables 657 698
Other non-Global Financing related 98 85
Total $«17,583 $«15,996
Long-term:
Net investment in sales-type leases $«««6,010 $«««6,505
Commercial financing receivables 197 462
Customer loans receivable 4,300 4,179
Installment payment receivables 217 273
Other non-Global Financing related 17 21
Total $«10,741 $«11,440
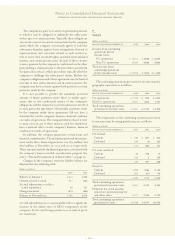
Net investment in sales-type leases is for leases that relate
principally to IBM equipment and are generally for terms
ranging from two to five years. Net investment in sales-type
leases includes unguaranteed residual values of $845 million
and $821 million at December 31, 2003 and 2002, respectively,
and is reflected net of unearned income of $1,227 million and
$1,330 million and of allowance for uncollectible accounts of
$337 million and $361 million at those dates, respectively.
Scheduled maturities of minimum lease payments outstand-
ing at December 31, 2003, expressed as a percentage of the
total, are approximately as follows: 2004, 53 percent; 2005,
29 percent; 2006, 13 percent; 2007, 4 percent; and 2008 and
beyond, 1 percent.
Customer loans receivable are provided by Global
Financing to the company’s clients to finance the purchase
of the company’s software and services. Global Financing
is one of many sources of funding from which clients can
choose. Separate contractual relationships on these financing
arrangements are generally for terms ranging from one to
three years requiring straight-line payments over the term.
Each financing contract is priced independently at competi-
tive market rates. The company has a history of enforcing
the terms of these separate financing agreements.
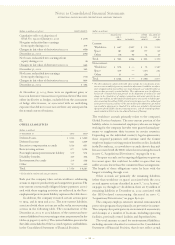
G
plant, rental machines and other property
(dollars in millions)
AT DECEMBER 31: 2003 2002
Land and land improvements $««««««865 $««««««837
Buildings and building
improvements 9,261 8,978
Plant, laboratory and
office equipment 22,317 21,416
32,443 31,231
Less: Accumulated depreciation 19,190 18,525
13,253 12,706
Rental machines 4,679 4,852
Less: Accumulated depreciation 3,243 3,118
1,436 1,734
Total $«14,689 $«14,440
Notes to Consolidated Financial Statements
INTERNATIONAL BUSINESS MACHINES CORPORATION AND SUBSIDIARY COMPANIES
93