IBM 2003 Annual Report Download - page 74
Download and view the complete annual report
Please find page 74 of the 2003 IBM annual report below. You can navigate through the pages in the report by either clicking on the pages listed below, or by using the keyword search tool below to find specific information within the annual report.-
 1
1 -
2
-
3
-
4
-
5
-
6
-
7
-
8
-
9
-
10
-
11
-
12
-
13
-
14
-
15
-
16
-
17
-
18
-
19
-
20
-
21
-
22
-
23
-
24
-
25
-
26
-
27
-
28
-
29
-
30
-
31
-
32
-
33
-
34
-
35
-
36
-
37
-
38
-
39
-
40
-
41
-
42
-
43
-
44
-
45
-
46
-
47
-
48
-
49
-
50
-
51
-
52
-
53
-
54
-
55
-
56
-
57
-
58
-
59
-
60
-
61
-
62
-
63
-
 64
64 -
 65
65 -
 66
66 -
 67
67 -
 68
68 -
 69
69 -
 70
70 -
 71
71 -
 72
72 -
 73
73 -
 74
74 -
 75
75 -
 76
76 -
 77
77 -
 78
78 -
 79
79 -
 80
80 -
 81
81 -
 82
82 -
 83
83 -
 84
84 -
85
-
86
-
87
-
88
-
89
-
90
-
91
-
92
-
93
-
94
-
95
-
96
-
97
-
98
-
99
-
100
-
101
-
102
-
103
-
104
-
105
-
106
-
107
-
108
-
109
-
110
-
111
-
112
-
113
-
114
-
115
-
116
-
117
-
118
-
119
-
120
-
121
-
122
-
123
-
124
-
125
-
126
-
127
-
128
 |
 |
December 31, 2003. The decrease in specific reserves was due
to the write-off of reserved receivables during the period com-
bined with lower requirements for additional specific reserves.
This lower requirement is generally due to improving eco-
nomic conditions as well as portfolio management to reduce
risk in areas of concern such as the Communications sector.
Global Financing’s bad debt expense declined to $206
million for the year ended December 31, 2003, compared
with $576 million for the year ended December 31, 2002. The
decline was primarily attributed to higher reserve additions
required in 2002 primarily associated with the Communica-
tions sector, as compared to 2003. This issue has stabilized
and contributed to the lower year-to-year charges.
Residual Value
Residual value is a risk unique to the financing business and
management of this risk is dependent upon the ability to
accurately project future equipment values. Global
Financing has insight into product plans and cycles for the
IBM products under lease. Based upon this product infor-
mation, Global Financing continually monitors projections
of future equipment values and compares them to the resid-
ual values reflected in the portfolio. See note A, “Significant
Accounting Policies,” on page 85 for the company’s account-
ing policy for residual values.
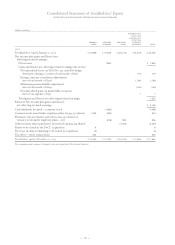
Sales of equipment, which are primarily sourced from
equipment returned at end of lease, represented 40.5 per-
cent of Global Financing’s revenue in 2003 and 32.1 percent
in 2002. The increase is driven by higher internal used equip-
ment sales, due to improved utilization of used inventory,
primarily zSeries, combined with a decline in finance income
driven by a lower average asset base. The gross margin on
these sales was 30.2 percent and 28.5 percent in 2003 and
2002, respectively. In addition to selling assets that are
sourced from end of lease, Global Financing also leases used
equipment to new customers or extends leasing arrange-
ments with current customers. These are other ways that
Global Financing profitably recovers the residual values. The
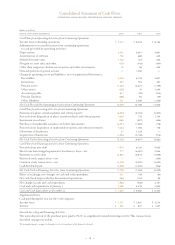
following table presents the recorded amount of unguaran-
teed residual value for sales-type and operating leases at
December 31, 2002 and 2003. In addition, the table presents
the residual value as a percentage of the original amount
financed, and a run out of the unguaranteed residual value
over the remaining lives of these leases at December 31,
2003. In addition to the unguaranteed residual value below,
on a limited basis, Global Financing will purchase insurance
to guarantee the future value of the equipment scheduled to
be returned at end of lease.
Management Discussion
INTERNATIONAL BUSINESS MACHINES CORPORATION AND SUBSIDIARY COMPANIES
72
Residual Value
(dollars in millions)
TOTAL RUN OUT OF 2003 BALANCE
2007 AND
AT DECEMBER 31: 2002 2003 2004 2005 2006 BEYOND
Sales-type leases $««««««821 $««««««845 $«284 $«311 $«210 $«40
Operating leases 242 164 88 49 17 10
To tal unguaranteed residual value $«««1,063 $«««1,009 $«372 $«360 $«227 $«50
Related original amount financed $«27,534*$«27,820
Percentage 3.9% 3.6%
*Reclassified to conform with 2003 presentation.
The decrease in the percentage of residual value to original amount financed was due to an increase in the percentage of leases
that use bargain purchase options.
Debt
AT DECEMBER 31: 2003 2002
Debt to equity ratio 6.9x 6.9x
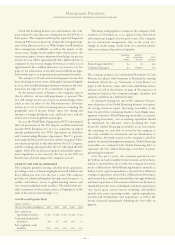
Global Financing funds its operations primarily through bor-
rowings using a debt-to-equity ratio of approximately 7 to 1.
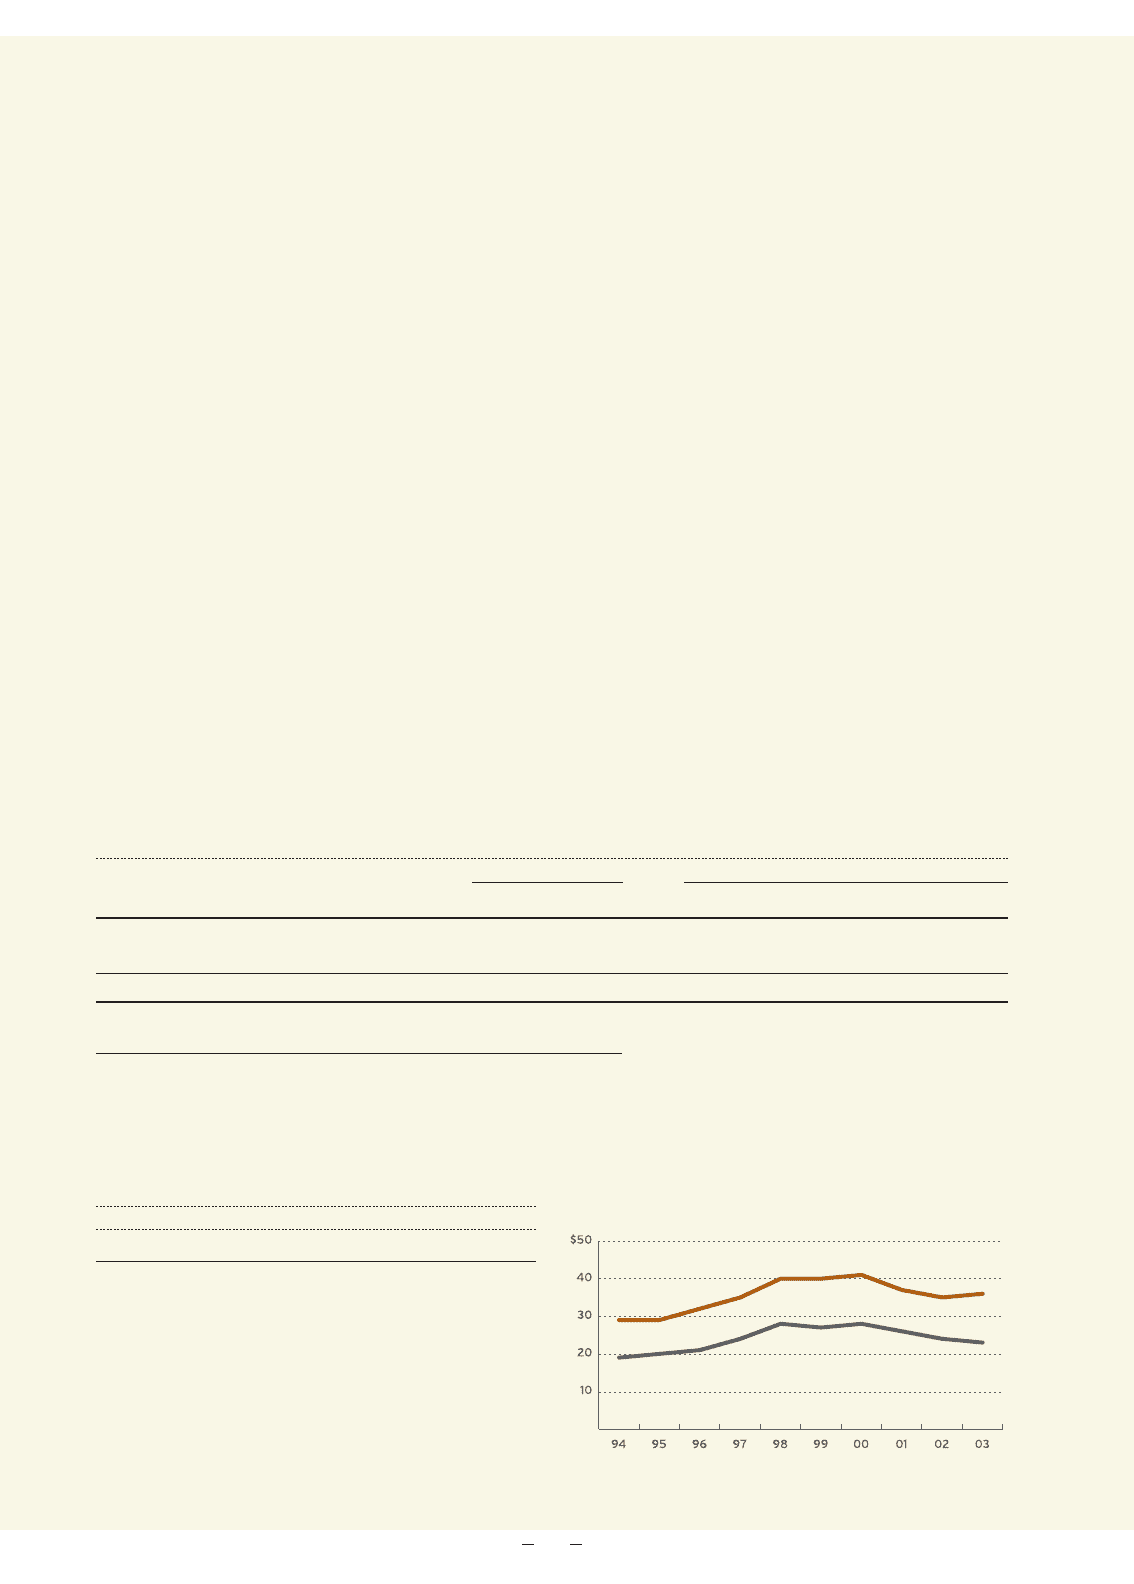
The following table illustrates the correlation between
Global Financing assets and Global Financing debt. Both
assets and debt are presented in the Global Financing bal-
ance sheet on page 70.
Global Financing Assets and Debt
(dollars in millions)
■GLOBAL FINANCING ASSETS ■GLOBAL FINANCING DEBT