IBM 2003 Annual Report Download - page 105
Download and view the complete annual report
Please find page 105 of the 2003 IBM annual report below. You can navigate through the pages in the report by either clicking on the pages listed below, or by using the keyword search tool below to find specific information within the annual report.-
 1
1 -
2
-
3
-
4
-
5
-
6
-
7
-
8
-
9
-
10
-
11
-
12
-
13
-
14
-
15
-
16
-
17
-
18
-
19
-
20
-
21
-
22
-
23
-
24
-
25
-
26
-
27
-
28
-
29
-
30
-
31
-
32
-
33
-
34
-
35
-
36
-
37
-
38
-
39
-
40
-
41
-
42
-
43
-
44
-
45
-
46
-
47
-
48
-
49
-
50
-
51
-
52
-
53
-
54
-
55
-
56
-
57
-
58
-
59
-
60
-
61
-
62
-
63
-
64
-
65
-
66
-
67
-
68
-
69
-
70
-
71
-
72
-
73
-
74
-
75
-
76
-
77
-
78
-
79
-
80
-
81
-
82
-
83
-
84
-
85
-
86
-
87
-
88
-
89
-
90
-
91
-
92
-
93
-
94
-
 95
95 -
 96
96 -
 97
97 -
 98
98 -
 99
99 -
 100
100 -
 101
101 -
 102
102 -
 103
103 -
 104
104 -
 105
105 -
 106
106 -
 107
107 -
 108
108 -
 109
109 -
 110
110 -
 111
111 -
 112
112 -
 113
113 -
 114
114 -
 115
115 -
116
-
117
-
118
-
119
-
120
-
121
-
122
-
123
-
124
-
125
-
126
-
127
-
128
 |
 |

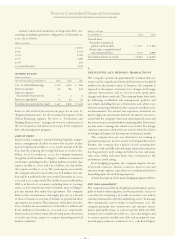
The company is a party to a variety of agreements pursuant
to which it may be obligated to indemnify the other party
with respect to certain matters. Typically, these obligations
arise in the context of contracts entered into by the company,
under which the company customarily agrees to hold the
other party harmless against losses arising from a breach of
representations and covenants related to such matters as
title to assets sold, certain IP rights, specified environmental
matters, and certain income taxes. In each of these circum-
stances, payment by the company is conditioned on the other
party making a claim pursuant to the procedures specified in
the particular contract, which procedures typically allow the
company to challenge the other party’s claims. Further, the
company’s obligations under these agreements may be limited
in terms of time and/or amount, and in some instances, the
company may have recourse against third parties for certain
payments made by the company.
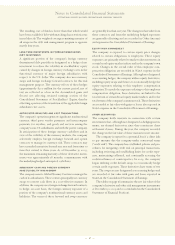
It is not possible to predict the maximum potential
amount of future payments under these or similar agree-
ments due to the conditional nature of the company’s
obligations and the unique facts and circumstances involved
in each particular agreement. Historically, payments made
by the company under these agreements did not have a
material effect on the company’s business, financial condition
or results of operations. The company believes that if it were
to incur a loss in any of these matters, such loss should not
have a material effect on the company’s business, financial
condition or results of operations.
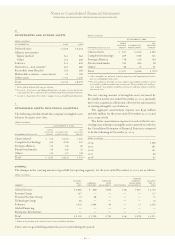
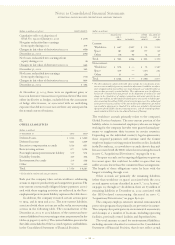
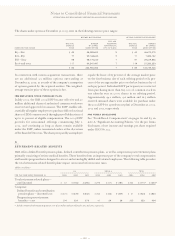
In addition, the company guarantees certain loans and
financial commitments. The maximum potential future pay-
ment under these financial guarantees was $74 million and
$126 million at December 31, 2003 and 2002, respectively.
These amounts include the limited guarantee associated with
the company’s loans receivable securitization program. See
note J, “Sale and Securitization of Receivables,” on page 95.
Changes in the company’s warranty liability balance are
illustrated in the following table.
(dollars in millions)
2003 2002
Balance at January 1 $«614 $«520
Current period accruals 971 863
Accrual adjustments to reflect
actual experience 65 121
Charges incurred (870) (890)
Balance at December 31 $«780 $«614
Accrual adjustments in 2002 principally reflect a significant
increase in the failure rates of HDD components in the
company’s Server and Storage products as a result of prod-
uct transitions.
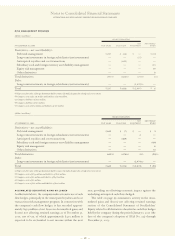
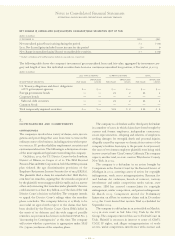
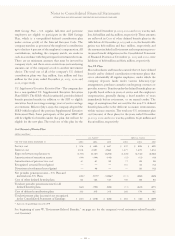
P
taxes
(dollars in millions)
FOR THE YEAR ENDED DECEMBER 31: 2003 2002 2001
Income from continuing
operations before
income taxes:
U.S. operations $«««4,611 $«3,838 $«««5,644
Non-U.S. operations 6,263 3,686 5,806
Total income from
continuing operations
before income taxes $«10,874 $«7,524 $«11,450
The continuing operations provision for income taxes by
geographic operations is as follows:
(dollars in millions)
FOR THE YEAR ENDED DECEMBER 31: 2003 2002 2001
U.S. operations $«1,234 $««««934 $«1,543
Non-U.S. operations 2,027 1,256 1,761
Total continuing operations
provision for income taxes $«3,261 $«2,190 $«3,304
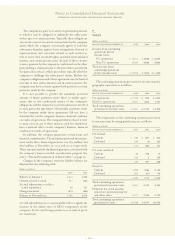
The components of the continuing operations provision
for income taxes by taxing jurisdiction are as follows:
(dollars in millions)
FOR THE YEAR ENDED DECEMBER 31: 2003 2002 2001
U.S. federal:
Current $««««234 $««««287 $««««434
Deferred 339 (3) 333
573 284 767
U.S. state and local:
Current 46 184 73
Deferred 183 3155
229 187 228
Non-U.S.:
Current 1,855 1,786 2,133
Deferred 604 (67) 176
2,459 1,719 2,309
Total continuing operations
provision for income taxes 3,261 2,190 3,304
Provision for social security,
real estate, personal property
and other taxes 3,277 2,789 2,730
Total continuing operations
provision for taxes $«6,538 $«4,979 $«6,034
Notes to Consolidated Financial Statements
INTERNATIONAL BUSINESS MACHINES CORPORATION AND SUBSIDIARY COMPANIES
103