IBM 2003 Annual Report Download - page 100
Download and view the complete annual report
Please find page 100 of the 2003 IBM annual report below. You can navigate through the pages in the report by either clicking on the pages listed below, or by using the keyword search tool below to find specific information within the annual report.-
 1
1 -
2
-
3
-
4
-
5
-
6
-
7
-
8
-
9
-
10
-
11
-
12
-
13
-
14
-
15
-
16
-
17
-
18
-
19
-
20
-
21
-
22
-
23
-
24
-
25
-
26
-
27
-
28
-
29
-
30
-
31
-
32
-
33
-
34
-
35
-
36
-
37
-
38
-
39
-
40
-
41
-
42
-
43
-
44
-
45
-
46
-
47
-
48
-
49
-
50
-
51
-
52
-
53
-
54
-
55
-
56
-
57
-
58
-
59
-
60
-
61
-
62
-
63
-
64
-
65
-
66
-
67
-
68
-
69
-
70
-
71
-
72
-
73
-
74
-
75
-
76
-
77
-
78
-
79
-
80
-
81
-
82
-
83
-
84
-
85
-
86
-
87
-
88
-
89
-
 90
90 -
 91
91 -
 92
92 -
 93
93 -
 94
94 -
 95
95 -
 96
96 -
 97
97 -
 98
98 -
 99
99 -
 100
100 -
 101
101 -
 102
102 -
 103
103 -
 104
104 -
 105
105 -
 106
106 -
 107
107 -
 108
108 -
 109
109 -
 110
110 -
111
-
112
-
113
-
114
-
115
-
116
-
117
-
118
-
119
-
120
-
121
-
122
-
123
-
124
-
125
-
126
-
127
-
128
 |
 |

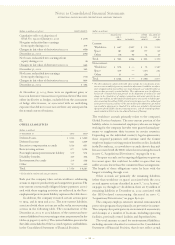
ACCUMULATED DERIVATIVE GAINS OR LOSSES
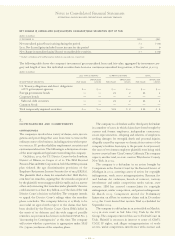
As illustrated above, the company makes extensive use of cash
flow hedges, principally in the Anticipated royalties and cost
transactions risk management program. In connection with
the company’s cash flow hedges, it has recorded approxi-
mately $454 million of net losses in Accumulated gains and
(losses) not affecting retained earnings as of December 31,
2003, net of tax, of which approximately $405 million is
expected to be reclassified to net income within the next
year, providing an offsetting economic impact against the
underlying anticipated cash flows hedged.
The table on page 99 summarizes activity in the Accu-
mulated gains and (losses) not affecting retained earnings
section of the Consolidated Statement of Stockholders’
Equity related to all derivatives classified as cash flow hedges
held by the company during the periods January 1, 2001 (the
date of the company’s adoption of SFAS No. 133) through
December 31, 2003:
Notes to Consolidated Financial Statements
INTERNATIONAL BUSINESS MACHINES CORPORATION AND SUBSIDIARY COMPANIES
98
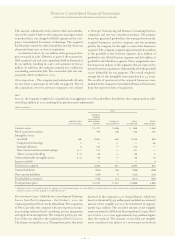
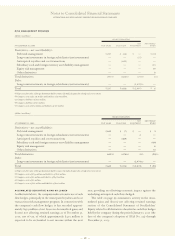
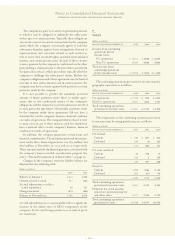
RISK MANAGEMENT PROGRAM
(dollars in millions)
HEDGE DESIGNATION
NET NON-HEDGE/
AT DECEMBER 31, 2003 FAIR VALUE CASH FLOW INVESTMENT OTHER
Derivatives—net asset/(liability):
Debt risk management $«297 $«««(23) $«««««««— $«(10)
Long-term investments in foreign subsidiaries (net investments) ——(27) —
Anticipated royalties and cost transactions —(643) — —
Subsidiary cash and foreign currency asset/liability management ———(31)
Equity risk management ———39
Other derivatives ——— 8
Total derivatives 297 (b) (666) (c) (27) (d) 6(e)
Debt:
Long-term investments in foreign subsidiaries (net investments) ——(2,470) (a) —
Total $«297 $«(666) $«(2,497) $««««6
(a) Represents fair value of foreign denominated debt issuances formally designated as a hedge of net investment.
(b)Comprises assets of $1,083 million and liabilities of $786 million.
(c) Comprises liabilities of $666 million.
(d) Comprises liabilities of $27 million.
(e) Comprises assets of $73 million and liabilities of $67 million.
(dollars in millions)
HEDGE DESIGNATION
NET NON-HEDGE/
AT D ECEMBER 31, 2002 FAIR VALUE CASH FLOW INVESTMENT OTHER
Derivatives—net asset/(liability):
Debt risk management $«643 $«««««(7) $«««««««— $«««««3
Long-term investments in foreign subsidiaries (net investments) —— 2—
Anticipated royalties and cost transactions —(469) — —
Subsidiary cash and foreign currency asset/liability management ———(109)
Equity risk management ——— 6
Other derivatives ———10
Total derivatives 643 (b) (476) (c) 2(d) (90) (e)
Debt:
Long-term investments in foreign subsidiaries (net investments) ——(2,474) (a) —
Total $«643 $«(476) $«(2,472) $««(90)
(a) Represents fair value of foreign denominated debt issuances formally designated as a hedge of net investment.
(b)Comprises assets of $754 million and liabilities of $111 million.
(c) Comprises assets of $2 million and liabilities of $478 million.
(d) Comprises assets of $2 million.
(e) Comprises assets of $26 million and liabilities of $116 million.