IBM 2003 Annual Report Download - page 76
Download and view the complete annual report
Please find page 76 of the 2003 IBM annual report below. You can navigate through the pages in the report by either clicking on the pages listed below, or by using the keyword search tool below to find specific information within the annual report.-
 1
1 -
2
-
3
-
4
-
5
-
6
-
7
-
8
-
9
-
10
-
11
-
12
-
13
-
14
-
15
-
16
-
17
-
18
-
19
-
20
-
21
-
22
-
23
-
24
-
25
-
26
-
27
-
28
-
29
-
30
-
31
-
32
-
33
-
34
-
35
-
36
-
37
-
38
-
39
-
40
-
41
-
42
-
43
-
44
-
45
-
46
-
47
-
48
-
49
-
50
-
51
-
52
-
53
-
54
-
55
-
56
-
57
-
58
-
59
-
60
-
61
-
62
-
63
-
64
-
65
-
 66
66 -
 67
67 -
 68
68 -
 69
69 -
 70
70 -
 71
71 -
 72
72 -
 73
73 -
 74
74 -
 75
75 -
 76
76 -
 77
77 -
 78
78 -
 79
79 -
 80
80 -
 81
81 -
 82
82 -
 83
83 -
 84
84 -
 85
85 -
 86
86 -
87
-
88
-
89
-
90
-
91
-
92
-
93
-
94
-
95
-
96
-
97
-
98
-
99
-
100
-
101
-
102
-
103
-
104
-
105
-
106
-
107
-
108
-
109
-
110
-
111
-
112
-
113
-
114
-
115
-
116
-
117
-
118
-
119
-
120
-
121
-
122
-
123
-
124
-
125
-
126
-
127
-
128
 |
 |

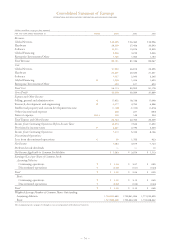
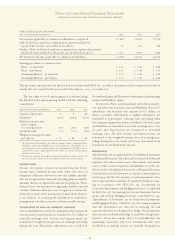
74
(dollars in millions except per share amounts)
FOR THE YEAR ENDED DECEMBER 31: NOTES 2003 2002 2001
Revenue:
Global Services $«42,635 $«36,360 $«34,956
Hardware 28,239 27,456 30,593
Software 14,311 13,074 12,939
Global Financing 2,826 3,232 3,426
Enterprise Investments/Other 1,120 1,064 1,153
Total Revenue 89,131 81,186 83,067
Cost:
Global Services 31,903 26,812 25,355
Hardware 20,401 20,020 21,231
Software 1,927 2,043 2,265
Global Financing K1,248 1,416 1,693
Enterprise Investments/Other 634 611 634
Total Cost 56,113 50,902 51,178
Gross Profit 33,018 30,284 31,889
Expense and Other Income:
Selling, general and administrative Q17,852 18,738 17,048
Research, development and engineering R5,077 4,750 4,986
Intellectual property and custom development income (1,168) (1,100) (1,476)
Other (income) and expense 238 227 (353)
Interest expense K & L 145 145 234
Total Expense and Other Income 22,144 22,760 20,439
Income from Continuing Operations Before Income Taxes 10,874 7,524 11,450
Provision for income taxes P3,261 2,190 3,304
Income from Continuing Operations 7,613 5,334 8,146
Discontinued Operations:
Loss from discontinued operations C30 1,755 423
Net Income 7,583 3,579 7,723
Preferred stock dividends ——10
Net Income Applicable to Common Stockholders $«««7,583 $«««3,579 $«««7,713
Earnings/(Loss) per Share of Common Stock:
Assuming Dilution:
Continuing operations T$«««««4.34 $«««««3.07 $«««««4.59
Discontinued operations T(0.02) (1.01) (0.24)
Total T$«««««4.32 $«««««2.06 $«««««4.35
Basic:
Continuing operations T$«««««4.42 $«««««3.13 $«««««4.69
Discontinued operations T(0.02) (1.03) (0.24)
Total T$«««««4.40 $«««««2.10 $«««««4.45
Weighted-Average Number of Common Shares Outstanding:
Assuming dilution 1,756,090,689 1,730,941,054 1,771,230,599
Basic 1,721,588,628 1,703,244,345 1,733,348,422
The accompanying notes on pages 80 through 121 are an integral part of the financial statements.
Consolidated Statement of Earnings
INTERNATIONAL BUSINESS MACHINES CORPORATION AND SUBSIDIARY COMPANIES