IBM 2003 Annual Report Download - page 106
Download and view the complete annual report
Please find page 106 of the 2003 IBM annual report below. You can navigate through the pages in the report by either clicking on the pages listed below, or by using the keyword search tool below to find specific information within the annual report.-
 1
1 -
2
-
3
-
4
-
5
-
6
-
7
-
8
-
9
-
10
-
11
-
12
-
13
-
14
-
15
-
16
-
17
-
18
-
19
-
20
-
21
-
22
-
23
-
24
-
25
-
26
-
27
-
28
-
29
-
30
-
31
-
32
-
33
-
34
-
35
-
36
-
37
-
38
-
39
-
40
-
41
-
42
-
43
-
44
-
45
-
46
-
47
-
48
-
49
-
50
-
51
-
52
-
53
-
54
-
55
-
56
-
57
-
58
-
59
-
60
-
61
-
62
-
63
-
64
-
65
-
66
-
67
-
68
-
69
-
70
-
71
-
72
-
73
-
74
-
75
-
76
-
77
-
78
-
79
-
80
-
81
-
82
-
83
-
84
-
85
-
86
-
87
-
88
-
89
-
90
-
91
-
92
-
93
-
94
-
95
-
 96
96 -
 97
97 -
 98
98 -
 99
99 -
 100
100 -
 101
101 -
 102
102 -
 103
103 -
 104
104 -
 105
105 -
 106
106 -
 107
107 -
 108
108 -
 109
109 -
 110
110 -
 111
111 -
 112
112 -
 113
113 -
 114
114 -
 115
115 -
 116
116 -
117
-
118
-
119
-
120
-
121
-
122
-
123
-
124
-
125
-
126
-
127
-
128
 |
 |

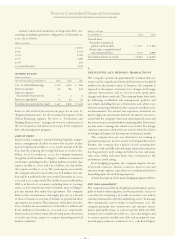
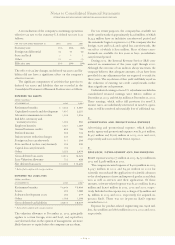
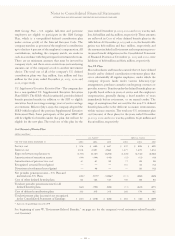
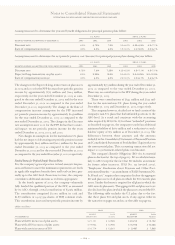
Areconciliation of the company’s continuing operations
effective tax rate to the statutory U.S. federal tax rate is as
follows:
FOR THE YEAR ENDED DECEMBER 31: 2003 2002 2001
Statutory rate 35% 35% 35%
Foreign tax differential (5) (7) (6)
State and local 111
Other (1) —(1)
Effective rate 30% 29% 29%
The effect of tax law changes on deferred tax assets and lia-
bilities did not have a significant effect on the company’s
effective tax rate.
The significant components of activities that gave rise to
deferred tax assets and liabilities that are recorded in the
Consolidated Statement of Financial Position were as follows:
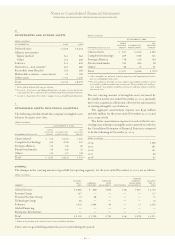
DEFERRED TAX ASSETS
(dollars in millions)
AT D ECEMBER 31: 2003 2002*
Retirement benefits $«««3,566 $«««3,587
Capitalized research and development 1,907 2,251
Alternative minimum tax credits 1,344 1,316
Bad debt, inventory and
warranty reserves 1,092 992
Employee benefits 1,021 1,069
General business credits 884 798
Deferred income 598 733
Infrastructure reduction charges 440 560
Foreign tax loss carryforwards 311 304
State and local tax loss carryforwards 205 239
Capital loss carryforwards 195 —
Other 2,253 2,474
Gross deferred tax assets 13,816 14,323
Less: Valuation allowance 722 628
Net deferred tax assets $«13,094 $«13,695
*Reclassified to conform with 2003 presentation.
DEFERRED TAX LIABILITIES
(dollars in millions)
AT D ECEMBER 31: 2003 2002*
Retirement benefits $«6,644 $«5,904
Leases 693 1,088
Software development costs 285 219
Other 1,188 1,308
Gross deferred tax liabilities $«8,810 $«8,519
*Reclassified to conform with 2003 presentation.
The valuation allowance at December 31, 2003, principally
applies to certain foreign, state and local, and capital loss
carryforwards that, in the opinion of management, are more
likely than not to expire before the company can use them.
For tax return purposes, the company has available tax
credit carryforwards of approximately $2,228 million, of which
$1,344 million have an indefinite carryforward period and
the remainder begin to expire in 2005. The company also has
foreign, state and local, and capital loss carryforwards, the
tax effect of which is $711 million. Most of these carry-
forwards are available for five years or have an indefinite
carryforward period.
During 2003, the Internal Revenue Service (IRS) com-
menced an examination of the years 1998 through 2000.
Although the outcome of tax audits is always uncertain, the
company believes that adequate amounts of tax have been
provided for any adjustments that are expected to result for
these years. The resolution of this audit will likely result in
the reduction of existing tax credit carryforwards rather
than a significant cash payment.
Undistributed earnings of non-U. S. subsidiaries included in
consolidated retained earnings were $18,120 million at
December 31, 2003, and $16,631 million at December 31, 2002.
These earnings, which reflect full provision for non-U.S.
income taxes, are indefinitely reinvested in non-U.S. opera-
tions or will be remitted substantially free of additional tax.
Q
advertising and promotional expense
Advertising and promotional expense, which includes
media, agency and promotional expense, was $1,406 million,
$1,427 million and $1,615 million in 2003, 2002 and 2001,
respectively, and is recorded in SG&A expense.
R
research, development and engineering
RD&E expense was $5,077 million in 2003, $4,750 million in
2002 and $4,986 million in 2001.
The company incurred expense of $4,609 million in 2003,
$4,247 million in 2002 and $4,321 million in 2001 for
scientific research and the application of scientific advances
to the development of new and improved products and their
uses as well as services and their application. Of these
amounts, software-related expense was $2,300 million, $1,974
million and $1,926 million in 2003, 2002 and 2001, respec-
tively. Included in the expense was a charge of $9 million and
$4 million in 2003 and 2002, respectively, for acquired in-
process R&D. There was no in-process R&D expense
recorded in 2001.
Expense for product-related engineering was $468 mil-
lion, $503 million and $665 million in 2003, 2002 and 2001,
respectively.
Notes to Consolidated Financial Statements
INTERNATIONAL BUSINESS MACHINES CORPORATION AND SUBSIDIARY COMPANIES
104