IBM 2003 Annual Report Download - page 61
Download and view the complete annual report
Please find page 61 of the 2003 IBM annual report below. You can navigate through the pages in the report by either clicking on the pages listed below, or by using the keyword search tool below to find specific information within the annual report.-
 1
1 -
2
-
3
-
4
-
5
-
6
-
7
-
8
-
9
-
10
-
11
-
12
-
13
-
14
-
15
-
16
-
17
-
18
-
19
-
20
-
21
-
22
-
23
-
24
-
25
-
26
-
27
-
28
-
29
-
30
-
31
-
32
-
33
-
34
-
35
-
36
-
37
-
38
-
39
-
40
-
41
-
42
-
43
-
44
-
45
-
46
-
47
-
48
-
49
-
50
-
 51
51 -
 52
52 -
 53
53 -
 54
54 -
 55
55 -
 56
56 -
 57
57 -
 58
58 -
 59
59 -
 60
60 -
 61
61 -
 62
62 -
 63
63 -
 64
64 -
 65
65 -
 66
66 -
 67
67 -
 68
68 -
 69
69 -
 70
70 -
 71
71 -
72
-
73
-
74
-
75
-
76
-
77
-
78
-
79
-
80
-
81
-
82
-
83
-
84
-
85
-
86
-
87
-
88
-
89
-
90
-
91
-
92
-
93
-
94
-
95
-
96
-
97
-
98
-
99
-
100
-
101
-
102
-
103
-
104
-
105
-
106
-
107
-
108
-
109
-
110
-
111
-
112
-
113
-
114
-
115
-
116
-
117
-
118
-
119
-
120
-
121
-
122
-
123
-
124
-
125
-
126
-
127
-
128
 |
 |

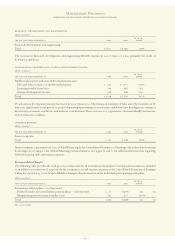
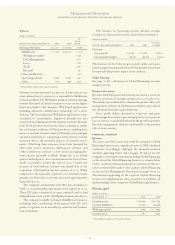
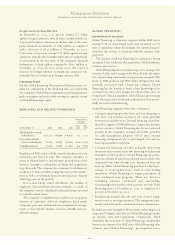
(dollars in millions)
AT DECEMBER 31: 2003 2002
Total company debt $«23,632 $«26,017
Non-Global Financing debt*««««««368 «««2,189
Non-Global Financing debt/
capitalization 1.5% 10.2%
*Non-Global Financing debt is the company’s total external debt less the Global Financing
debt described in the Global Financing balance sheet on pages 70, 72 and 73.
During the fourth quarter of 2002, the company increased
its non-Global Financing debt to position itself for potential
year-end pension funding levels and the possible acquisition
of Rational, especially given the cash paid for PwCC during
the 2002 fourth quarter. Based upon the strong cash flows
from operations in 2003, the company reduced non-Global
Financing debt.
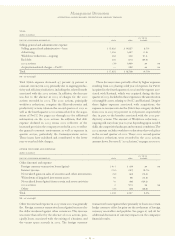
Equity
(dollars in millions)
YR. TO YR.
AT DECEMBER 31: 2003 2002 CHANGE
Stockholders’ equity:
Total $«27,864 $«22,782 22.3%
The company’s total consolidated Stockholders’ equity
increased $5,082 million during 2003 primarily due to an
increase in the company’s retained earnings partially offset
by the company’s ongoing stock repurchase program and
higher dividend payments.
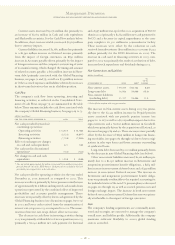
Off-Balance Sheet Arrangements
The company, in the ordinary course of business, entered
into off-balance sheet arrangements as defined by the SEC
Final Rule 67 (FR-67), “Disclosure in Management’s
Discussion and Analysis about Off-Balance Sheet
Arrangements and Aggregate Contractual Obligations,”
including: certain guarantees, indemnifications and retained
interests in assets transferred to an unconsolidated entity for
securitization purposes.
None of these off-balance sheet arrangements either has,
or is reasonably likely to have, a material current or future
effect on financial condition, changes in financial condition,
revenues or expenses, results of operations, liquidity, capital
expenditures or capital resources. See pages 65 and 66 for the
company’s contractual obligations.
See note O, “Contingencies and Commitments,” on pages
102 and 103, for detailed information about the company’s
guarantees on certain loans and financial commitments,
indemnification arrangements and loans receivable securiti-
zation program.
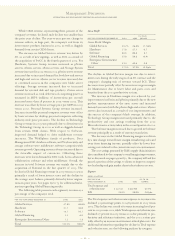
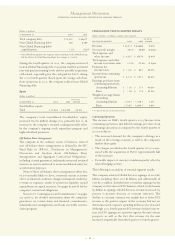
CONSOLIDATED FOURTH QUARTER RESULTS
(dollars and shares in millions except per share amounts)
YR. TO YR.
FOR FOURTH QUARTER: 2003 2002 CHANGE
Revenue $«25,913 $«23,684 9.4% *
Gross profit margin 38.4% 38.8% (0.4) pts.
Total expense and
other income $«««6,097 $«««6,479 (5.9) %
Total expense and other
income-to-revenue ratio 23.5% 27.4% (3.9) pts.
Provision for
income taxes $«««1,162 $««««««801 45.0%
Income from continuing
operations $«««2,716 $«««1,911 42.2%
Earnings per share from
continuing operations:
Assuming dilution $«««««1.56 $«««««1.11 40.5%
Basic $«««««1.59 $«««««1.12 42.0%
Weighted-average shares
outstanding:
Assuming dilution 1,745.7 1,728.7 1.0%
Basic 1,708.5 1,699.1 0.6%
*0.8 percent increase at constant currency
Continuing Operations
The increase in IBM’s fourth quarter 2003 Income from
continuing operations and diluted earnings per share from
continuing operations as compared to the fourth quarter of
2002 was due to:
•The increased demand for the company’s offerings as a
result of the reviving economy as well as the company’s
market share gains
•The charges recorded in the fourth quarter of 2002 asso-
ciated with the acquisition of PwCC (approximately half
of the increase)
•Favorable impact of currency translation partly offset by
related hedging activity
The following is an analysis of external segment results.
The company achieved Global Services signings of over $17
billion, including three over $1 billion, and additionally, 18
over $100 million. Included were several key signings for the
company’s relatively new BTO business, which totaled nearly
$3 billion in signings. Global Services revenue increased 8.3
percent (1 percent decrease at constant currency). The
decline at constant currency was mainly due to lower BCS
revenue as the positive impact of the economy had not yet
driven increased corporate spending in this area by year-end.
Although 2003 fourth quarter BCS revenue declined year-to-
year, its BTO signings are a positive sign for the unit’s future
prospects as well as the fact that revenue for the unit
increased sequentially from third quarter to fourth quarter.
Management Discussion
INTERNATIONAL BUSINESS MACHINES CORPORATION AND SUBSIDIARY COMPANIES
59