IBM 2003 Annual Report Download - page 53
Download and view the complete annual report
Please find page 53 of the 2003 IBM annual report below. You can navigate through the pages in the report by either clicking on the pages listed below, or by using the keyword search tool below to find specific information within the annual report.-
 1
1 -
2
-
3
-
4
-
5
-
6
-
7
-
8
-
9
-
10
-
11
-
12
-
13
-
14
-
15
-
16
-
17
-
18
-
19
-
20
-
21
-
22
-
23
-
24
-
25
-
26
-
27
-
28
-
29
-
30
-
31
-
32
-
33
-
34
-
35
-
36
-
37
-
38
-
39
-
40
-
41
-
42
-
 43
43 -
 44
44 -
 45
45 -
 46
46 -
 47
47 -
 48
48 -
 49
49 -
 50
50 -
 51
51 -
 52
52 -
 53
53 -
 54
54 -
 55
55 -
 56
56 -
 57
57 -
 58
58 -
 59
59 -
 60
60 -
 61
61 -
 62
62 -
 63
63 -
64
-
65
-
66
-
67
-
68
-
69
-
70
-
71
-
72
-
73
-
74
-
75
-
76
-
77
-
78
-
79
-
80
-
81
-
82
-
83
-
84
-
85
-
86
-
87
-
88
-
89
-
90
-
91
-
92
-
93
-
94
-
95
-
96
-
97
-
98
-
99
-
100
-
101
-
102
-
103
-
104
-
105
-
106
-
107
-
108
-
109
-
110
-
111
-
112
-
113
-
114
-
115
-
116
-
117
-
118
-
119
-
120
-
121
-
122
-
123
-
124
-
125
-
126
-
127
-
128
 |
 |

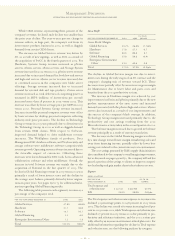
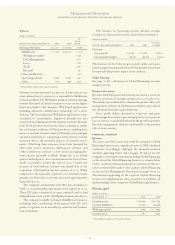
Full-year geographic revenue increased across all geogra-
phies. In the Americas, U.S . and Canada, revenue grew as did
Latin America, notably in Brazil. In Europe/Middle East/
Africa, revenue performance was highest in the U. K.,
Central Europe and Middle East and Africa. In Asia Pacific,
2003 revenue for Japan, which is 60 percent of the
region’s revenue, increased compared with 2002, while the
Australia/New Zealand and ASEAN regions achieved the
strongest performance.
year in review
RESULTS OF CONTINUING OPERATIONS
Revenue
(dollars in millions)
YR. TO YR.
PERCENT
YR. TO YR. CHANGE
PERCENT CONSTANT
FOR THE YEAR ENDED DECEMBER 31: 2003 2002 CHANGE CURRENCY
Statement of Earnings Revenue Presentation:
Global Services $«42,635 $«36,360 17.3% 9.3%
Hardware 28,239 27,456 2.9 (2.9)
Software 14,311 13,074 9.4 1.9
Global Financing 2,826 3,232 (12.6) (17.6)
Enterprise Investments/Other 1,120 1,064 5.2 (2.9)
Total $«89,131 $«81,186 9.8% 2.8%
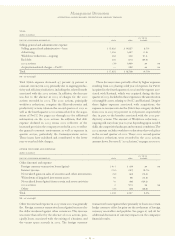
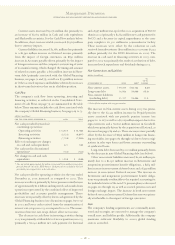
(dollars in millions)
YR. TO YR.
PERCENT
YR. TO YR. CHANGE
PERCENT CONSTANT
FOR THE YEAR ENDED DECEMBER 31: 2003 2002*CHANGE CURRENCY
Industry Sector:
Financial Services $«22,323 $«19,799 12.8% 4.8%
Public 13,977 12,171 14.8 8.5
Industrial 11,763 10,320 14.0 6.3
Distribution 8,079 7,751 4.2 (1.9)
Communications 8,009 7,406 8.1 1.5
Small & Medium 19,809 17,371 14.0 6.0
OEM 2,634 3,350 (21.4) (21.8)
Other 2,537 3,018 (15.9) (17.3)
Total $«89,131 $«81,186 9.8% 2.8%
*Reclassified to conform with 2003 presentation.
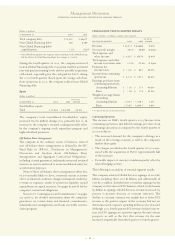
(dollars in millions)
YR. TO YR.
PERCENT
YR. TO YR. CHANGE
PERCENT CONSTANT
FOR THE YEAR ENDED DECEMBER 31: 2003 2002 CHANGE CURRENCY
Geographies:
Americas $«38,078 $«36,423 4.5% 3.7%
Europe/Middle East/Africa 29,102 24,260 20.0 3.1
Asia Pacific 19,317 17,153 12.6 5.1
OEM 2,634 3,350 (21.4) (21.8)
Total $«89,131 $«81,186 9.8% 2.8%
Revenue for all industry sectors increased in 2003 on an as-
reported basis. The Financial Services sector, Public sector
and Industrial sector were among the strongest, with continued
growth in the Small & Medium Business sector. These results
reflect the company’s go-to-market strategy of designing
industry-specific solutions. See the discussion on page 52 for
the decrease in OEM. The decline in Other sector revenue
was due to a decrease in customer revenue not allocated to
an industry sector and other adjustments.
Management Discussion
INTERNATIONAL BUSINESS MACHINES CORPORATION AND SUBSIDIARY COMPANIES
51