IBM 2003 Annual Report Download - page 66
Download and view the complete annual report
Please find page 66 of the 2003 IBM annual report below. You can navigate through the pages in the report by either clicking on the pages listed below, or by using the keyword search tool below to find specific information within the annual report.-
 1
1 -
2
-
3
-
4
-
5
-
6
-
7
-
8
-
9
-
10
-
11
-
12
-
13
-
14
-
15
-
16
-
17
-
18
-
19
-
20
-
21
-
22
-
23
-
24
-
25
-
26
-
27
-
28
-
29
-
30
-
31
-
32
-
33
-
34
-
35
-
36
-
37
-
38
-
39
-
40
-
41
-
42
-
43
-
44
-
45
-
46
-
47
-
48
-
49
-
50
-
51
-
52
-
53
-
54
-
55
-
 56
56 -
 57
57 -
 58
58 -
 59
59 -
 60
60 -
 61
61 -
 62
62 -
 63
63 -
 64
64 -
 65
65 -
 66
66 -
 67
67 -
 68
68 -
 69
69 -
 70
70 -
 71
71 -
 72
72 -
 73
73 -
 74
74 -
 75
75 -
 76
76 -
77
-
78
-
79
-
80
-
81
-
82
-
83
-
84
-
85
-
86
-
87
-
88
-
89
-
90
-
91
-
92
-
93
-
94
-
95
-
96
-
97
-
98
-
99
-
100
-
101
-
102
-
103
-
104
-
105
-
106
-
107
-
108
-
109
-
110
-
111
-
112
-
113
-
114
-
115
-
116
-
117
-
118
-
119
-
120
-
121
-
122
-
123
-
124
-
125
-
126
-
127
-
128
 |
 |

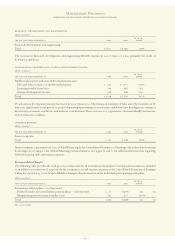
Given the declining interest rate environment, the com-
pany reduced its discount rate assumption for the PPP by 75
basis points. The company will keep the expected long-term
return on PPP assets at 8 percent, despite the strong perform-
ance of the plan assets in 2003. With similar overall trends in
these assumptions worldwide, as well as the impact of the
recent years’ changes in the market value of plan assets, the
year-to-year impact from retirement-related plans on pre-tax
income in 2004 will be approximately $650 million (lower) as
compared to year-to-year changes between 2002 and 2003 of
approximately $600 million (lower in 2003 versus 2002). See
page 117 for a discussion of recently enacted Medicare legis-
lation with respect to nonpension postretirement benefits.
The amount of IP and custom development income has
been declining in recent years. Although it increased slightly
in 2003, the overall declining trend may continue as the com-
pany does not expect it to be a contributor to growth.
In the normal course of business, the company expects
that its effective tax rate will approximate 30 percent. The
rate will change year-to-year based on nonrecurring events
(such as the tax effect of the Microelectronics Division’s
actions in 2002) as well as recurring factors, including the
geographic mix of income before taxes, the timing and
amount of foreign dividends, state and local taxes, and the
interaction of various global tax strategies.
In 2001, the World Trade Organization (WTO) determined
that tax provisions of the FSC Repeal and Extraterritorial
Income (ETI) Exclusion Act of 2000 constitute an export
subsidy prohibited by the WTO Agreement on Subsidies
and Countervailing Measures Agreement. The U. S. govern-
ment appealed the panel’s decision and lost its appeal. There
are various proposals at this time before the U.S. Congress,
and the company anticipates that the U.S. will repeal the ETI
regime. If the ETI exclusion is repealed and suitable replace-
ment legislation is not enacted, the loss of the ETI tax
benefit may adversely impact the company’s tax rate.
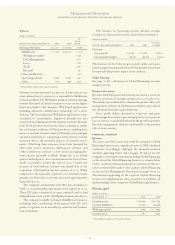
LIQUIDITY AND CAPITAL RESOURCES
The company generates strong cash flow from operations,
providing a source of funds ranging between $8.8 billion and
$14.6 billion per year over the past 5 years. The company
provides for additional liquidity through several sources—a
sizable cash balance, access to global funding sources and
two committed global credit facilities. The table below pro-
vides a summary of these major sources of liquidity as of the
ends of fiscal years 1999 through 2003.
Cash Flow and Liquidity Trends
(dollars in billions)
FOR THE YEAR ENDED DECEMBER 31: 1999 2000 2001 2002 2003
Net cash from
operating activities $««9.0 $««8.8 $«14.0 $«13.8 $«14.6
Cash and marketable
securities 5.8 3.7 6.4 6.0 7.6
Size of global credit
facilities 10.0 10.0 12.0 12.0 10.0
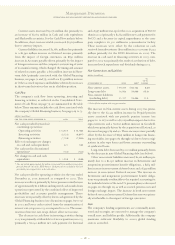
The major rating agencies’ ratings on the company’s debt
securities at December 31, 2003, appear in the table below
and remain unchanged over the past 5 years. The company
has no contractual arrangements that, in the event of a
change in credit rating, would result in a material adverse
effect on its financial position or liquidity.
STANDARD MOODY’S
AND INVESTORS FITCH
POOR’S SERVICE RATINGS
Senior long-term debt A+ A1 AA-
Commercial paper A-1 Prime-1 f-1+
The company prepares its Consolidated Statement of Cash
Flows in accordance with Statement of Financial Accounting
Standards (SFAS)No. 95, “Statement of Cash Flows,” on
page 79 and discusses causes and events underlying sources
and uses of cash in that format on page 58. For purposes of
running its business, the company manages, monitors and
analyzes cash flows in a different format.
As discussed on page 69, one of the company’s two pri-
mary objectives of its Global Financing business is to gener-
ate strong return-on-equity. Increasing receivables is the
basis for growth in a financing business. Accordingly, man-
agement considers Global Financing receivables as a profit-
generating investment—not as working capital that should
be minimized for efficiency. After classifying the Cash
(from)/for Global Financing receivables as an investment,
the remaining net cash flow is viewed by the company as
the Cash available for investment and for distribution to
shareholders. And with respect to the company’s cash flow
analysis for internal management purposes, Global Financing
receivables are combined with Global Financing debt to
represent the Net Global Financing receivables (a profit-
generating investment).
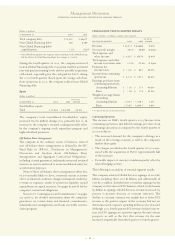
Over the past 5 years, the company generated over
$57 billion in Cash available for investment and for distri-
bution to shareholders. As a result, the company invested a
net $2.5 billion in its Global Financing business, made $22.5
billion of net capital expenditures, invested $7.6 billion in
strategic acquisitions, received $6.2 billion from divestitures
and returned $32.9 billion to shareholders through dividends
and share repurchases. The amount of future year Returns to
shareholders in the form of dividends and share repurchases
vary based upon several factors including affordability,
namely each year’s operating results, capital expenditures,
research and development, and acquisitions, as well as the
factors discussed immediately following the first table on
page 65.
Management Discussion
INTERNATIONAL BUSINESS MACHINES CORPORATION AND SUBSIDIARY COMPANIES
64