IBM 2003 Annual Report Download - page 60
Download and view the complete annual report
Please find page 60 of the 2003 IBM annual report below. You can navigate through the pages in the report by either clicking on the pages listed below, or by using the keyword search tool below to find specific information within the annual report.-
 1
1 -
2
-
3
-
4
-
5
-
6
-
7
-
8
-
9
-
10
-
11
-
12
-
13
-
14
-
15
-
16
-
17
-
18
-
19
-
20
-
21
-
22
-
23
-
24
-
25
-
26
-
27
-
28
-
29
-
30
-
31
-
32
-
33
-
34
-
35
-
36
-
37
-
38
-
39
-
40
-
41
-
42
-
43
-
44
-
45
-
46
-
47
-
48
-
49
-
 50
50 -
 51
51 -
 52
52 -
 53
53 -
 54
54 -
 55
55 -
 56
56 -
 57
57 -
 58
58 -
 59
59 -
 60
60 -
 61
61 -
 62
62 -
 63
63 -
 64
64 -
 65
65 -
 66
66 -
 67
67 -
 68
68 -
 69
69 -
 70
70 -
71
-
72
-
73
-
74
-
75
-
76
-
77
-
78
-
79
-
80
-
81
-
82
-
83
-
84
-
85
-
86
-
87
-
88
-
89
-
90
-
91
-
92
-
93
-
94
-
95
-
96
-
97
-
98
-
99
-
100
-
101
-
102
-
103
-
104
-
105
-
106
-
107
-
108
-
109
-
110
-
111
-
112
-
113
-
114
-
115
-
116
-
117
-
118
-
119
-
120
-
121
-
122
-
123
-
124
-
125
-
126
-
127
-
128
 |
 |

Current assets increased $3,276 million due primarily to
an increase of $1,672 million in Cash and cash equivalents
and Marketable securities. See the Cash Flow analysis below.
In addition, short-term receivables increased $1,565 million
due to currency impacts.
Current liabilities increased $3,680 million due primarily
to a $1,546 million increase in Deferred income primarily
from the impact of foreign currencies, an $830 million
increase in Accounts payable driven primarily by the impact
of foreign currencies and the company’s outsourcing of some
of its manufacturing, which changed the timing and amount
of related accounts payable, a $615 million increase in Short-
term debt (primarily associated with the Global Financing
business, see pages 72 and 73), as well as a $743 million increase
in Other accrued expenses and liabilities driven by increases
in short-term derivatives that are in a liability position.
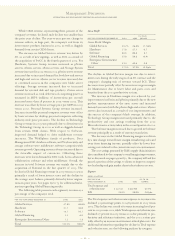
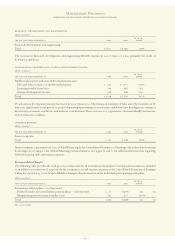
Cash Flow
The company’s cash flow from operating, investing and
financing activities, as reflected in the Consolidated State-
ment of Cash Flows on page 79, are summarized in the table
below. These amounts include the cash flows associated with
the company’s Global Financing business. See pages 69 to 73.
(dollars in millions)
FOR THE YEAR ENDED DECEMBER 31: 2003 2002
Net cash provided by/(used in)
continuing operations:
Operating activities $«14,569 $«13,788
Investing activities (5,122) (6,897)
Financing activities (7,798) (7,265)
Effect of exchange rate changes
on cash and cash equivalents 421 148
Net cash used in discontinued
operations*(162) (722)
Net change in cash and cash
equivalents $«««1,908 $«««««(948)
*Does not include approximately $97 million in 2003 and $1,170 million in 2002 of net
proceeds from the sale of the HDD business. Such proceeds are included in Net cash
provided by investing activities in the table above.
Net cash provided by operating activities for the year ended
December 31, 2003 increased as compared to 2002. This
increase was driven primarily by lower pension contributions
of approximately $1.6 billion and improved cash results from
operations represented by the combined effect of improved
profitability and accounts payable management. These
increases were partially offset by lower cash generated by the
Global Financing business (see discussion on pages 69 to 73)
in 2003 and lower cash received from the monetization of
interest rate swaps in 2003 as compared to 2002. The mone-
tization of interest rate swaps did not affect net income.
The decrease in cash flows in investing activities during
2003 was primarily attributable to fewer acquisitions in 2003
(primarily a $1,042 million net cash payment for Rational
and a $397 million true-up for the 2002 acquisition of PwCC)
than in 2002 (primarily a $2,852 million net cash payment for
PwCC) and a decrease in capital expenditures as the com-
pany completes its 300 millimeter semiconductor facility.
These increases were offset by the reduction in cash
received from divestitures ($97 million in 2003 versus $1,233
million primarily for the HDD divestiture in 2002). The
increase in cash used in financing activities in 2003 com-
pared to 2002 was primarily the result of a reduction of debt,
increased stock repurchases and dividends during 2003.
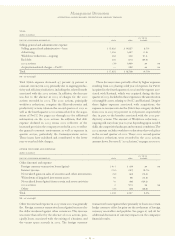
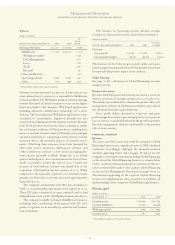
Non-Current Assets and Liabilities
(dollars in millions)
YR.
TO YR.
AT DECEMBER 31: 2003 2002*CHANGE
Non-current assets $«59,459 $«54,762 8.6%
Long-term debt 16,986 19,986 (15.0)
Non-current liabilities
(excluding debt) 21,707 19,496 11.3
*Reclassified to conform with 2003 presentation.
The increase in Non-current assets during 2003 was prima-
rily due to the $2,423 million increase in Prepaid pension
assets associated with net periodic pension income (see
pages 110 to 117) as well as a $1,015 million impact due to for-
eign currencies and a $2,806 million increase in Goodwill,
which was primarily driven by the acquisition of Rational, as
discussed on pages 89 and 90. These increases were partially
offset by the decrease of $699 million in Long-term financ-
ing receivables (see pages 69 through 73) due to lower origi-
nations in sales type leases and lower amounts outstanding
of syndicated loans.
Long-term debt decreased $3,000 million primarily driven
by the decrease in non-Global Financing debt (see below).
Other non-current liabilities increased $2,211 million pri-
marily due to a $1,036 million increase in Retirement and
nonpension postretirement benefit obligations, a $384 mil-
lion increase in non-current deferred taxes and a $433 million
increase in non-current Deferred income. The increase in
Retirement and nonpension postretirement benefit obliga-
tions was primarily attributable to the required accounting for
the unfunded status of the non-U.S. pension plans as discussed
on pages 110 through 115, as well as accrued pension costs and
foreign exchange impact. The increase in both non-current
deferred taxes and non-current Deferred income was prima-
rily attributable to the impact of foreign currencies.
Debt
The company’s funding requirements are continually moni-
tored and strategies are executed to manage the company’s
overall asset and liability profile. Additionally, the company
maintains sufficient flexibility to access global funding
sources as needed.
Management Discussion
INTERNATIONAL BUSINESS MACHINES CORPORATION AND SUBSIDIARY COMPANIES
58