IBM 2003 Annual Report Download - page 122
Download and view the complete annual report
Please find page 122 of the 2003 IBM annual report below. You can navigate through the pages in the report by either clicking on the pages listed below, or by using the keyword search tool below to find specific information within the annual report.-
 1
1 -
2
-
3
-
4
-
5
-
6
-
7
-
8
-
9
-
10
-
11
-
12
-
13
-
14
-
15
-
16
-
17
-
18
-
19
-
20
-
21
-
22
-
23
-
24
-
25
-
26
-
27
-
28
-
29
-
30
-
31
-
32
-
33
-
34
-
35
-
36
-
37
-
38
-
39
-
40
-
41
-
42
-
43
-
44
-
45
-
46
-
47
-
48
-
49
-
50
-
51
-
52
-
53
-
54
-
55
-
56
-
57
-
58
-
59
-
60
-
61
-
62
-
63
-
64
-
65
-
66
-
67
-
68
-
69
-
70
-
71
-
72
-
73
-
74
-
75
-
76
-
77
-
78
-
79
-
80
-
81
-
82
-
83
-
84
-
85
-
86
-
87
-
88
-
89
-
90
-
91
-
92
-
93
-
94
-
95
-
96
-
97
-
98
-
99
-
100
-
101
-
102
-
103
-
104
-
105
-
106
-
107
-
108
-
109
-
110
-
111
-
 112
112 -
 113
113 -
 114
114 -
 115
115 -
 116
116 -
 117
117 -
 118
118 -
 119
119 -
 120
120 -
 121
121 -
 122
122 -
 123
123 -
 124
124 -
 125
125 -
 126
126 -
 127
127 -
 128
128
 |
 |

Notes to Consolidated Financial Statements
INTERNATIONAL BUSINESS MACHINES CORPORATION AND SUBSIDIARY COMPANIES
120
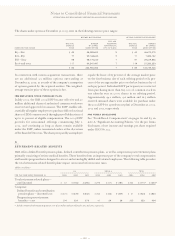
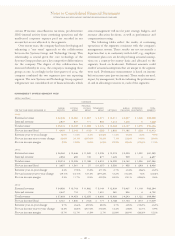
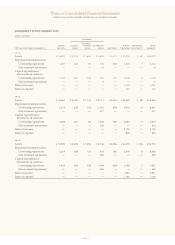
MANAGEMENT SYSTEM SEGMENT VIEW
(dollars in millions)
HARDWARE
PERSONAL
GLOBAL SYSTEMS SYSTEMS TECHNOLOGY GLOBAL ENTERPRISE TOTAL
FOR THE YEAR ENDED DECEMBER 31: SERVICES GROUP GROUP GROUP SOFTWARE FINANCING INVESTMENTS SEGMENTS
2003:
Assets $«16,683 $«2,916 $«1,894 $«5,852 $«5,017 $«35,916 $«««69 $«68,347
Depreciation/amortization:
Continuing operations 1,487 344 95 766 883 2,160 7 5,742
Discontinued operations ———10———10
Capital expenditures/
investment in software:
Continuing operations 1,753 301 109 940 691 2,318 6 6,118
Discontinued operations ——— 5——— 5
Interest income —————2,349 — 2,349
Interest expense —————653—653
2002:
Assets $«14,462 $«3,124 $«1,776 $«5,771 $«3,361 $«35,242 $«««88 $«63,824
Depreciation/amortization:
Continuing operations 1,213 335 116 1,167 809 2,413 8 6,061
Discontinued operations ———617———617
Capital expenditures/
investment in software:
Continuing operations 1,294 307 96 1,365 687 2,561 9 6,319
Discontinued operations ———323———323
Interest income —————2,703 — 2,703
Interest expense —————825—825
2001:
Assets $«10,340 $«3,208 $«1,904 $«9,136 $«3,356 $«36,670 $«106 $«64,720
Depreciation/amortization:
Continuing operations 1,219 308 131 676 782 2,476 8 5,600
Discontinued operations ———429———429
Capital expenditures/
investment in software:
Continuing operations 1,519 390 128 1,495 839 3,143 7 7,521
Discontinued operations ———360———360
Interest income —————2,941 — 2,941
Interest expense —————1,140 — 1,140