IBM 2003 Annual Report Download - page 56
Download and view the complete annual report
Please find page 56 of the 2003 IBM annual report below. You can navigate through the pages in the report by either clicking on the pages listed below, or by using the keyword search tool below to find specific information within the annual report.-
 1
1 -
2
-
3
-
4
-
5
-
6
-
7
-
8
-
9
-
10
-
11
-
12
-
13
-
14
-
15
-
16
-
17
-
18
-
19
-
20
-
21
-
22
-
23
-
24
-
25
-
26
-
27
-
28
-
29
-
30
-
31
-
32
-
33
-
34
-
35
-
36
-
37
-
38
-
39
-
40
-
41
-
42
-
43
-
44
-
45
-
 46
46 -
 47
47 -
 48
48 -
 49
49 -
 50
50 -
 51
51 -
 52
52 -
 53
53 -
 54
54 -
 55
55 -
 56
56 -
 57
57 -
 58
58 -
 59
59 -
 60
60 -
 61
61 -
 62
62 -
 63
63 -
 64
64 -
 65
65 -
 66
66 -
67
-
68
-
69
-
70
-
71
-
72
-
73
-
74
-
75
-
76
-
77
-
78
-
79
-
80
-
81
-
82
-
83
-
84
-
85
-
86
-
87
-
88
-
89
-
90
-
91
-
92
-
93
-
94
-
95
-
96
-
97
-
98
-
99
-
100
-
101
-
102
-
103
-
104
-
105
-
106
-
107
-
108
-
109
-
110
-
111
-
112
-
113
-
114
-
115
-
116
-
117
-
118
-
119
-
120
-
121
-
122
-
123
-
124
-
125
-
126
-
127
-
128
 |
 |

54
Management Discussion
INTERNATIONAL BUSINESS MACHINES CORPORATION AND SUBSIDIARY COMPANIES
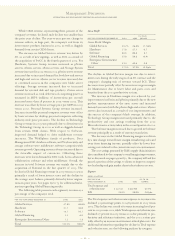
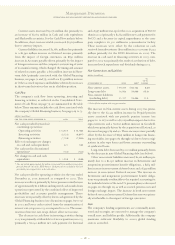
research, development and engineering
(dollars in millions)
YR. TO YR.
FOR THE YEAR ENDED DECEMBER 31: 2003 2002 CHANGE
Research, development and engineering:
Total $«5,077 $«4,750 6.9%
The increase in Research, development and engineering (RD&E) expense in 2003 versus 2002 was primarily the result of
Software acquisitions.
intellectual property and custom development income
(dollars in millions)
YR. TO YR.
FOR THE YEAR ENDED DECEMBER 31: 2003 2002 CHANGE
Intellectual property and custom development income:
Sales and other transfers of intellectual property $÷÷562 $««««511 10.0%
Licensing/royalty-based fees 338 351 (3.7)
Custom development income 268 238 12.6
Total $«1,168 $«1,100 6.1%
IP and custom development income increased in 2003 versus 2002. The timing and amount of Sales and other transfers of IP
may vary significantly from period to period depending upon timing of new patents and know-how development, timing of
divestitures, economic conditions and industry consolidation. There were no 2003 agreements that individually had income
of more than $100 million.
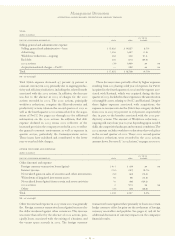
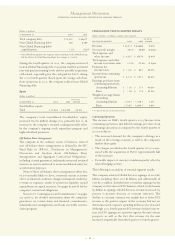
interest expense
(dollars in millions)
YR. TO YR.
FOR THE YEAR ENDED DECEMBER 31: 2003 2002 CHANGE
Interest expense:
Total $«145 $«145 0.0%
Interest expense is presented in Cost of Global Financing in the Consolidated Statement of Earnings only if the related external
borrowings are to support the Global Financing external business. See pages 72 and 73 for additional information regarding
Global Financing debt and interest expense.
Retirement-Related Benefits
The following table provides the total pre-tax cost/(income) for all retirement-related plans. Cost/(income) amounts are included
as an addition to/reduction of, respectively, the company’s cost and expense amounts in the Consolidated Statement of Earnings
within the caption (e.g., Cost, SG&A, RD&E) relating to the job function of the individuals participating in the plans.
(dollars in millions)
YR. TO YR.
FOR THE YEAR ENDED DECEMBER 31: 2003 2002 CHANGE
Retirement-related plans—cost/(income):
Defined benefit and contribution pension plans—cost/(income) $«««27 $«(619) NM NM
Nonpension postretirement benefits costs 335 371 (9.7) %
Total $«362 $«(248) NM NM
NM—not meaningful