IBM 2003 Annual Report Download - page 116
Download and view the complete annual report
Please find page 116 of the 2003 IBM annual report below. You can navigate through the pages in the report by either clicking on the pages listed below, or by using the keyword search tool below to find specific information within the annual report.-
 1
1 -
2
-
3
-
4
-
5
-
6
-
7
-
8
-
9
-
10
-
11
-
12
-
13
-
14
-
15
-
16
-
17
-
18
-
19
-
20
-
21
-
22
-
23
-
24
-
25
-
26
-
27
-
28
-
29
-
30
-
31
-
32
-
33
-
34
-
35
-
36
-
37
-
38
-
39
-
40
-
41
-
42
-
43
-
44
-
45
-
46
-
47
-
48
-
49
-
50
-
51
-
52
-
53
-
54
-
55
-
56
-
57
-
58
-
59
-
60
-
61
-
62
-
63
-
64
-
65
-
66
-
67
-
68
-
69
-
70
-
71
-
72
-
73
-
74
-
75
-
76
-
77
-
78
-
79
-
80
-
81
-
82
-
83
-
84
-
85
-
86
-
87
-
88
-
89
-
90
-
91
-
92
-
93
-
94
-
95
-
96
-
97
-
98
-
99
-
100
-
101
-
102
-
103
-
104
-
105
-
 106
106 -
 107
107 -
 108
108 -
 109
109 -
 110
110 -
 111
111 -
 112
112 -
 113
113 -
 114
114 -
 115
115 -
 116
116 -
 117
117 -
 118
118 -
 119
119 -
 120
120 -
 121
121 -
 122
122 -
 123
123 -
 124
124 -
 125
125 -
 126
126 -
127
-
128
 |
 |

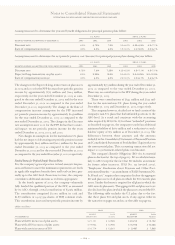
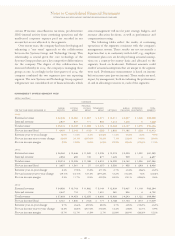
The changes in the Expected long-term return on plan assets
in 2003 and 2002 for the PPP decreased net periodic pension
income by approximately $715 million and $224 million,
respectively, for the year ended December 31, 2003 as com-
pared to the year ended December 31, 2002 and for the year
ended December 31, 2002 as compared to the year ended
December 31, 2001, respectively. The change in the Rate of
compensation increase assumption for the PPP increased
net periodic pension income by approximately $145 million
for the year ended December 31, 2003 as compared to the
year ended December 31, 2002. The changes in the Discount
rate assumption since 2001 for the PPP did not have a mate-
rial impact on net periodic pension income for the years
ended December 31, 2003, 2002, and 2001.
Net changes in assumptions for the material non-U. S. plans
had the net impact of decreasing net periodic pension income
by approximately $225 million and $200 million for the year
ended December 31, 2003 as compared to the year ended
December 31, 2002 and for the year ended December 31, 2002
as compared to the year ended December 31, 2001, respectively.
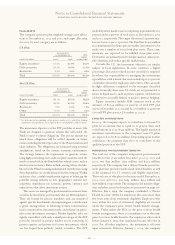
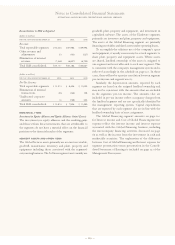
Funded Status for Defined Benefit Pension Plans
It is the company’s general practice to fund amounts for pen-
sions sufficient to meet the minimum requirements set forth
in applicable employee benefits laws and local tax laws, gen-
erally up to the ABO level. From time to time, the company
contributes additional amounts as it deems appropriate.
In the fourth quarter of 2002, the company voluntarily
fully funded the qualilfied portion of the PPP, as measured
by its ABO, through a total contribution of $3,963 million.
The contribution comprised $2,092 million in cash and
$1,871 million, or 24,037,354 shares, of IBM common stock.
This contribution increased net periodic pension income by
approximately $375 million during the year ended December 31,
2003 as compared to the year ended December 31, 2002.
There was no contribution to the PPP during the year ended
December 31, 2003.
There were contributions of $542 million and $225 mil-
lion for the material non-U.S. plans during the year ended
December 31, 2003 and December 31, 2002, respectively.
The company, however, decided not to fund certain of the
company’s non-U.S. plans that had unfunded positions to the
ABO level. As a result and consistent with the accounting
rules required by SFAS No. 87 for these “unfunded” positions
as described on page 111, the company recorded an additional
minimum liability of $560 million and a reduction to stock-
holders’ equity of $72 million as of December 31, 2003. The
differences between these amounts and the amounts
included in the Consolidated Statement of Financial Position
and Consolidated Statement of Stockholders’ Equity relate to
the non-material plans. This accounting transaction did not
impact 2003 retirement-related plans cost/(income).
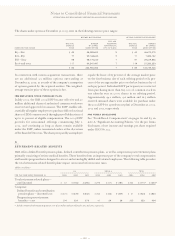
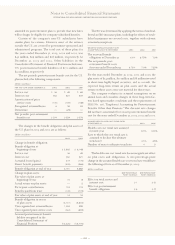
The company’s Benefit Obligation (BO) for its material
plans is disclosed at the top of page 113. BO is calculated simi-
larly to ABO except for the fact that BO includes an estimate
for future salary increases. SFAS No. 132 (revised 2003),
“Employers’ Disclosures about Pensions and Other Post-
retirement Benefits—an amendment of FASB Statements No.
87, 88 and 106,” requires that companies disclose the aggregate
BO and plan assets of all plans in which the BO exceeds plan
assets. Similar disclosure is required for all plans in which the
ABO exceeds plan assets. The aggregate BO and plan assets are
also disclosed for plans in which the plan assets exceed the BO.
The following table excludes the U. S. plans due to the fact
that these plans’ BO and plan assets, if any, appear either in
the narrative on pages 111 and 112 or the table on page 113.
Notes to Consolidated Financial Statements
INTERNATIONAL BUSINESS MACHINES CORPORATION AND SUBSIDIARY COMPANIES
114
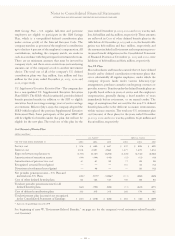
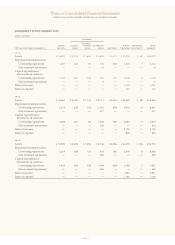
Assumptions used to determine the year-end benefit obligations for principal pension plans follow:
U.S. PLANS NON-U.S. PLANS
WEIGHTED-AVERAGE ASSUMPTIONS AT DECEMBER 31: 2003 2002 2001 2003 2002 2001
Discount rate 6.0% 6.75% 7.0% 3.0–6.0% 4.25–6.5% 4.5–7.1%
Rate of compensation increase 4.0% 4.0% 6.0% 1.5–5.0% 2.2–5.0% 2.0–6.1%
Assumptions used to determine the net periodic pension cost/(income) for principal pension plans during the year follow:
U.S. PLANS NON-U.S. PLANS
WEIGHTED-AVERAGE ASSUMPTIONS FOR YEARS ENDED DECEMBER 31: 2003 2002 2001 2003 2002 2001
Discount rate 6.75% 7.0% 7.25% 4.25–6.5% 4.5–7.1% 4.5–7.1%
Expected long-term return on plan assets 8.0% 9.50% 10.0% 5.0–8.0% 5.0–9.25% 5.0–10.0%
Rate of compensation increase 4.0% 6.0% 6.0% 2.2–5.0% 2.0–6.1% 2.6–6.1%
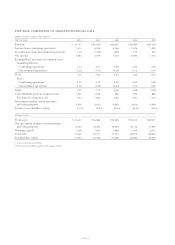
(dollars in millions)
2003 2002
BENEFIT PLAN BENEFIT PLAN
AT DECEMBER 31: OBLIGATION ASSETS OBLIGATION ASSETS
Plans with BO in excess of plan assets $«21,101 $«12,985 $«20,212 $«13,132
Plans with ABO in excess of plan assets $«19,902 $«12,985 $«15,978 $«10,086
Plans with assets in excess of BO $«10,774 $«13,561 $«««5,487 $«««7,505