IBM 2003 Annual Report Download - page 63
Download and view the complete annual report
Please find page 63 of the 2003 IBM annual report below. You can navigate through the pages in the report by either clicking on the pages listed below, or by using the keyword search tool below to find specific information within the annual report.-
 1
1 -
2
-
3
-
4
-
5
-
6
-
7
-
8
-
9
-
10
-
11
-
12
-
13
-
14
-
15
-
16
-
17
-
18
-
19
-
20
-
21
-
22
-
23
-
24
-
25
-
26
-
27
-
28
-
29
-
30
-
31
-
32
-
33
-
34
-
35
-
36
-
37
-
38
-
39
-
40
-
41
-
42
-
43
-
44
-
45
-
46
-
47
-
48
-
49
-
50
-
51
-
52
-
 53
53 -
 54
54 -
 55
55 -
 56
56 -
 57
57 -
 58
58 -
 59
59 -
 60
60 -
 61
61 -
 62
62 -
 63
63 -
 64
64 -
 65
65 -
 66
66 -
 67
67 -
 68
68 -
 69
69 -
 70
70 -
 71
71 -
 72
72 -
 73
73 -
74
-
75
-
76
-
77
-
78
-
79
-
80
-
81
-
82
-
83
-
84
-
85
-
86
-
87
-
88
-
89
-
90
-
91
-
92
-
93
-
94
-
95
-
96
-
97
-
98
-
99
-
100
-
101
-
102
-
103
-
104
-
105
-
106
-
107
-
108
-
109
-
110
-
111
-
112
-
113
-
114
-
115
-
116
-
117
-
118
-
119
-
120
-
121
-
122
-
123
-
124
-
125
-
126
-
127
-
128
 |
 |

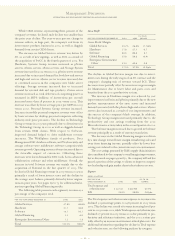
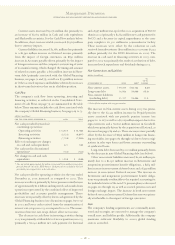
prior year in review
(dollars and shares in millions except per share amounts)
YR. TO YR.
FOR THE YEAR DECEMBER 31: 2002 2001 CHANGE
Revenue $«81,186 $«83,067 (2.3) % *
Gross profit margin 37.3% 38.4% (1.1) pts.
Total expense and
other income $«22,760 $«20,439 11.4%
Total expense and other
income-to-revenue ratio 28.0% 24.6% 3.4 pts.
Provision for
income taxes $«««2,190 $«««3,304 (33.7) %
Income from
continuing operations $«««5,334 $«««8,146 (34.5) %
Earnings per share from
continuing operations:
Assuming dilution $«««««3.07 $«««««4.59 (33.1) %
Basic $«««««3.13 $«««««4.69 (33.3) %
Discontinued operations:
Loss $«««1,755 $««««««423 NM NM
Diluted earnings
per share $««««(1.01) $««««(0.24) NM NM
Basic earnings
per share $««««(1.03) $««««(0.24) NM NM
Weighted-average
shares outstanding:
Assuming dilution 1,730.9 1,771.2 (2.3) %
Basic 1,703.2 1,733.3 (1.7) %
Assets** $«96,484 $«90,303 6.8%
Liabilities** $«73,702 $«66,855 10.2%
Equity** $«22,782 $«23,448 (2.8) %
*2.9 percent decrease at constant currency
** at December 31
NM—not meaningful
CONTINUING OPERATIONS
Income from continuing operations and diluted earnings
per share from continuing operations each declined over 30
percent in 2002 as compared to 2001. Over half of the
decline was attributable to after-tax charges of $1.2 billion
and $433 million associated with the 2002 second quarter
Microelectronics and productivity actions and the charges
related to the 2002 fourth quarter acquisition of PwCC,
respectively. The remainder of the decline was primarily due
to lower corporate spending on IT. Sector revenue in 2002
declined across all client sectors compared to 2001 with the
exception of the Public sector, which had strong growth in a
continuing tough economic climate. The Small & Medium
Business sector gained traction despite the economy, reflect-
ing the company’s increased focus on this client sector.
Geographic revenue declines were due to lower corpo-
rate spending on IT given the economic trends prevalent
from 2001 to 2002. Such declines were experienced in the
Americas compared with 2001, whereas Asia Pacific revenue
was essentially the same in 2002 as compared to 2001. Asia
Pacific’s revenue performance was slowed by a weak economy
in Japan (over 60 percent of Asia Pacific revenue), although
revenue growth was achieved in the ASEAN region.
Europe/Middle East/Africa’s revenue increased 1.1 percent,
although it declined 4 percent at constant currency, primarily
due to weakness in the U.K ., France and Germany, offset by
good performance in Italy.
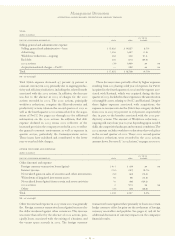
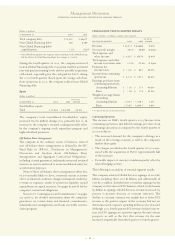
The following is an analysis of external segment results.
Global Services
Revenue increased 4.0 percent (3 percent at constant cur-
rency) to $36,360 million as a result of the fourth quarter
2002 acquisition of PwCC into the company’s BCS business.
SO revenue increased despite the economic downturn given
its annuity-like characteristics. ITS revenue also increased
due to increased deployment of network hardware and
connectivity services, business continuity services and
OEM alliances. The PwCC acquisition accounted for all of
BCS’s revenue increase. The company signed $53 billion of
services contracts in 2002, an increase of $2 billion versus
2001. The estimated services backlog at December 31, 2002,
was $112 billion.
Hardware Segments
Revenue declined 10.5 percent (11 percent at constant cur-
rency) to $27,630 million and is more sensitive to changes in
the economy and corporate IT spending levels relative to
Global Services. Systems Group revenue declined 8.0 per-
cent (10 percent at constant currency) across zSeries, iSeries,
pSeries and storage, although zSeries MIPS deliveries
increased 6 percent compared to 2001. xSeries also increased
as the company launched its blade offerings. Personal
Systems Group revenue declined 7.8 percent (9 percent at
constant currency) for the same reasons cited above.
Technology Group revenue declined 23.6 percent (23 percent
at constant currency) primarily due to divestiture of multi-
ple, non-core businesses during the year, including display
and card manufacturing.
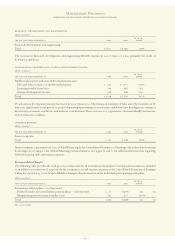
Software Group
Revenue increased 1.0 percent (flat at constant currency) to
$13,074 million. The company noted two trends in 2002.
First, clients were spending more time on the selection
process for software solutions and second, clients were more
inclined to negotiate smaller software arrangements, which
are perceived to provide a faster return on investment. The
company’s focus on client base expansion offset these two
trends. Modest growth in middleware products, particularly
in Data Management, WebSphere and Tivoli, offset declines
in operating system revenue, which is somewhat dependent
on hardware volumes.
Management Discussion
INTERNATIONAL BUSINESS MACHINES CORPORATION AND SUBSIDIARY COMPANIES
61