IBM 2003 Annual Report Download - page 54
Download and view the complete annual report
Please find page 54 of the 2003 IBM annual report below. You can navigate through the pages in the report by either clicking on the pages listed below, or by using the keyword search tool below to find specific information within the annual report.-
 1
1 -
2
-
3
-
4
-
5
-
6
-
7
-
8
-
9
-
10
-
11
-
12
-
13
-
14
-
15
-
16
-
17
-
18
-
19
-
20
-
21
-
22
-
23
-
24
-
25
-
26
-
27
-
28
-
29
-
30
-
31
-
32
-
33
-
34
-
35
-
36
-
37
-
38
-
39
-
40
-
41
-
42
-
43
-
 44
44 -
 45
45 -
 46
46 -
 47
47 -
 48
48 -
 49
49 -
 50
50 -
 51
51 -
 52
52 -
 53
53 -
 54
54 -
 55
55 -
 56
56 -
 57
57 -
 58
58 -
 59
59 -
 60
60 -
 61
61 -
 62
62 -
 63
63 -
 64
64 -
65
-
66
-
67
-
68
-
69
-
70
-
71
-
72
-
73
-
74
-
75
-
76
-
77
-
78
-
79
-
80
-
81
-
82
-
83
-
84
-
85
-
86
-
87
-
88
-
89
-
90
-
91
-
92
-
93
-
94
-
95
-
96
-
97
-
98
-
99
-
100
-
101
-
102
-
103
-
104
-
105
-
106
-
107
-
108
-
109
-
110
-
111
-
112
-
113
-
114
-
115
-
116
-
117
-
118
-
119
-
120
-
121
-
122
-
123
-
124
-
125
-
126
-
127
-
128
 |
 |

While OEM revenue, representing three percent of the
company’s revenue, declined, such decline was smaller than
the prior year decline. The year-to-year percent change in
revenue reflects, in large part, the company’s exit from its
interconnect products business in 2002, as well as sluggish
demand from certain OEM clients.
The increase in Global Services revenue was driven by
SO, as a result of new signings, as well as BCS, as a result of
the acquisition of PwCC in the fourth quarter of 2002. For
Hardware, Systems Group revenue increased as pSeries
servers, xSeries servers, zSeries servers and Storage System
revenue increased in 2003 versus 2002. pSeries server revenue
increased due to increased demand for both low-end servers
and high-end servers. xSeries server revenue increased due
to continued success in the company’s new blade server
offerings. Storage revenue increased due to increased
demand for external disk and tape products. zSeries server
revenue increased as total deliveries of computing power as
measured in MIPS (millions of instructions per second)
increased more than 28 percent in 2003 versus 2002. This
increase was offset by lower average price per MIPS in 2003
versus 2002. Personal Systems Group revenue increased.
Increases in mobile personal computer revenue were offset
by lower revenue for desktop personal computers reflecting
industry-wide price pressures. The decline in Technology
Group revenue in 2003 was primarily due to divestitures in
the Technology Group in 2002 as well as sluggish demand
from certain OEM clients. With respect to Software,
improved demand helped to drive middleware revenue
increases. The WebSphere family of products, Data
Management DB2database software, and Tivoli security and
storage software were middleware software categories with
revenue growth. Operating system software increased due to
the favorable impact of currencies. Offsetting these
increases were lower demand for DB2tools, Lotus advanced
collaboration software and other middleware. Overall, the
increase in total Software revenue was mainly due to the
acquisition of Rational in the first quarter of 2003. The
decline in Global Financing revenue in 2003 versus 2002 was
primarily a result of lower interest rates and the decline in
the average asset balance primarily driven by lower origina-
tions in prior years. See pages 69 to 73 for additional infor-
mation regarding Global Financing results.
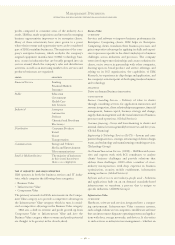
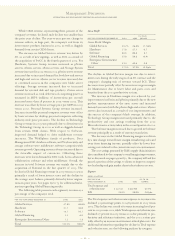
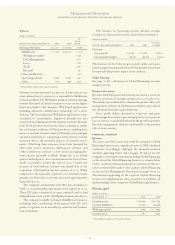
The following table presents each segment’s revenue as a
percentage of the company’s total.
FOR THE YEAR ENDED DECEMBER 31: 2003 2002
Global Services 47.8% 44.8%
Hardware 31.7 33.8
Software 16.1 16.1
Global Financing 3.2 4.0
Enterprise Investments/Other 1.2 1.3
Total 100.0% 100.0%
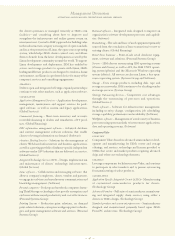
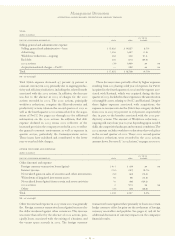
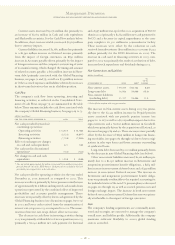
Gross Profit
YR. TO YR.
FOR THE YEAR ENDED DECEMBER 31: 2003 2002 CHANGE
Gross Profit Margin:
Global Services 25.2% 26.3% (1.1) pts.
Hardware 27.8 27.1 0.7
Software 86.5 84.4 2.1
Global Financing 55.8 56.2 (0.4)
Enterprise Investments/
Other 43.4 42.6 0.8
Total 37.0% 37.3% (0.3) pts.
The decline in Global Services margin was due to invest-
ment costs during the early stages of an SO contract and the
company’s changing mix of revenue toward BCS. These
decreases were partially offset by an increase in gross margin
for Maintenance due to lower labor and parts costs and
benefits from the 2002 productivity actions.
The increase in Hardware margin was achieved by cost
improvements in zSeries and pSeries primarily due to the new
product announcement of the z990 server and increased
demand associated with the pSeries high-end servers. xSeries
servers also increased as a result of cost improvements and
the success of the company’s blade strategy. In addition,
Technology Group margin increased primarily due to the
productivity and cost savings resulting from the 2002
Microelectronics actions taken in the second quarter of 2002.
The Software margin increased due to growth in Software
revenue principally as a result of currency translation.
The decrease in the Global Financing margin was driven
by a mix change toward lower margin remarketing sales and
away from financing income, partially offset by lower bor-
rowing costs related to the current interest rate environment.
The cost savings generated by IBM’s supply chain initiatives
also contributed to the company’s overall margin improvement,
but as discussed on pages 49 and 50, the company will and has
passed a portion of the savings to clients to improve competi-
tive leadership and gain market share in key industry sectors.
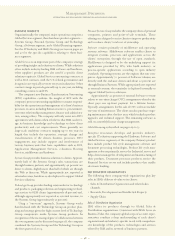
Expense
(dollars in millions)
FOR THE YEAR YR. TO YR.
ENDED DECEMBER 31: 2003 2002 CHANGE
Total expense and
other income $«22,144 $«22,760 (2.7) %
E/R 24.8% 28.0% (3.2) pts.
The Total expense and other income expense-to-revenue ratio
declined 3.2 percentage points to 24.8 percent in 2003 versus
2002. This decline was a result of revenue increasing by 9.8 per-
cent in 2003 versus 2002, while Total expense and other income
declined 2.7 percent in 2003 versus 2002 due primarily to pro-
ductivity and efficiency initiatives, and the 2002 actions par-
tially offset by an increase in retirement-related plan costs. For
additional information regarding the decline in Total expense
and other income, see the following analyses by category.
Management Discussion
INTERNATIONAL BUSINESS MACHINES CORPORATION AND SUBSIDIARY COMPANIES
52