Cisco 2012 Annual Report Download - page 91
Download and view the complete annual report
Please find page 91 of the 2012 Cisco annual report below. You can navigate through the pages in the report by either clicking on the pages listed below, or by using the keyword search tool below to find specific information within the annual report.-
 1
1 -
2
-
3
-
4
-
5
-
6
-
7
-
8
-
9
-
10
-
11
-
12
-
13
-
14
-
15
-
16
-
17
-
18
-
19
-
20
-
21
-
22
-
23
-
24
-
25
-
26
-
27
-
28
-
29
-
30
-
31
-
32
-
33
-
34
-
35
-
36
-
37
-
38
-
39
-
40
-
41
-
42
-
43
-
44
-
45
-
46
-
47
-
48
-
49
-
50
-
51
-
52
-
53
-
54
-
55
-
56
-
57
-
58
-
59
-
60
-
61
-
62
-
63
-
64
-
65
-
66
-
67
-
68
-
69
-
70
-
71
-
72
-
73
-
74
-
75
-
76
-
77
-
78
-
79
-
80
-
 81
81 -
 82
82 -
 83
83 -
 84
84 -
 85
85 -
 86
86 -
 87
87 -
 88
88 -
 89
89 -
 90
90 -
 91
91 -
 92
92 -
 93
93 -
 94
94 -
 95
95 -
 96
96 -
 97
97 -
 98
98 -
 99
99 -
 100
100 -
 101
101 -
102
-
103
-
104
-
105
-
106
-
107
-
108
-
109
-
110
-
111
-
112
-
113
-
114
-
115
-
116
-
117
-
118
-
119
-
120
-
121
-
122
-
123
-
124
-
125
-
126
-
127
-
128
-
129
-
130
-
131
-
132
-
133
-
134
-
135
-
136
-
137
-
138
-
139
-
140
-
141
-
142
-
143
-
144
-
145
-
146
-
147
-
148
-
149
-
150
-
151
-
152
 |
 |

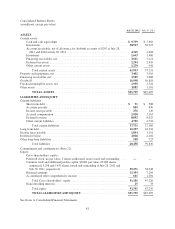
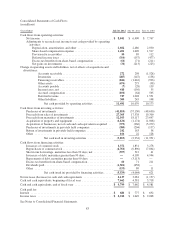
Consolidated Statements of Cash Flows
(in millions)
Years Ended July 28, 2012 July 30, 2011 July 31, 2010
Cash flows from operating activities:
Net income ................................................. $ 8,041 $ 6,490 $ 7,767
Adjustments to reconcile net income to net cash provided by operating
activities:
Depreciation, amortization, and other ........................ 2,602 2,486 2,030
Share-based compensation expense .......................... 1,401 1,620 1,517
Provision for receivables .................................. 50 89 112
Deferred income taxes .................................... (314) (157) (477)
Excess tax benefits from share-based compensation ............. (60) (71) (211)
Net gains on investments .................................. (31) (213) (223)
Change in operating assets and liabilities, net of effects of acquisitions and
divestitures:
Accounts receivable .................................. 272 298 (1,528)
Inventories ......................................... (287) (147) (158)
Financing receivables ................................. (846) (1,616) (996)
Other assets ........................................ (674) 275 (98)
Accounts payable .................................... (7) (28) 139
Income taxes, net .................................... 418 (156) 55
Accrued compensation ................................ (101) (64) 565
Deferred revenue .................................... 727 1,028 1,531
Other liabilities ...................................... 300 245 148
Net cash provided by operating activities ............. 11,491 10,079 10,173
Cash flows from investing activities:
Purchases of investments ...................................... (41,810) (37,130) (48,690)
Proceeds from sales of investments .............................. 27,365 17,538 19,300
Proceeds from maturities of investments .......................... 12,103 18,117 23,697
Acquisition of property and equipment ........................... (1,126) (1,174) (1,008)
Acquisition of businesses, net of cash and cash equivalents acquired . . . (375) (266) (5,279)
Purchases of investments in privately held companies ............... (380) (204) (137)
Return of investments in privately held companies .................. 242 163 58
Other ..................................................... 166 22 128
Net cash used in investing activities ................. (3,815) (2,934) (11,931)
Cash flows from financing activities:
Issuances of common stock .................................... 1,372 1,831 3,278
Repurchases of common stock .................................. (4,760) (6,896) (7,864)
Short-term borrowings, maturities less than 90 days, net ............. (557) 512 41
Issuances of debt, maturities greater than 90 days ................... —4,109 4,944
Repayments of debt, maturities greater than 90 days ................ —(3,113) —
Excess tax benefits from share-based compensation ................. 60 71 211
Dividends paid .............................................. (1,501) (658) —
Other ..................................................... (153) 80 11
Net cash (used in) provided by financing activities ...... (5,539) (4,064) 621
Net increase (decrease) in cash and cash equivalents .................... 2,137 3,081 (1,137)
Cash and cash equivalents, beginning of fiscal year ..................... 7,662 4,581 5,718
Cash and cash equivalents, end of fiscal year .......................... $ 9,799 $ 7,662 $ 4,581
Cash paid for:
Interest ........................................................ $ 681 $ 777 $ 692
Income taxes ................................................... $ 2,014 $ 1,649 $ 2,068
See Notes to Consolidated Financial Statements.
83