Cisco 2012 Annual Report Download - page 138
Download and view the complete annual report
Please find page 138 of the 2012 Cisco annual report below. You can navigate through the pages in the report by either clicking on the pages listed below, or by using the keyword search tool below to find specific information within the annual report.-
 1
1 -
2
-
3
-
4
-
5
-
6
-
7
-
8
-
9
-
10
-
11
-
12
-
13
-
14
-
15
-
16
-
17
-
18
-
19
-
20
-
21
-
22
-
23
-
24
-
25
-
26
-
27
-
28
-
29
-
30
-
31
-
32
-
33
-
34
-
35
-
36
-
37
-
38
-
39
-
40
-
41
-
42
-
43
-
44
-
45
-
46
-
47
-
48
-
49
-
50
-
51
-
52
-
53
-
54
-
55
-
56
-
57
-
58
-
59
-
60
-
61
-
62
-
63
-
64
-
65
-
66
-
67
-
68
-
69
-
70
-
71
-
72
-
73
-
74
-
75
-
76
-
77
-
78
-
79
-
80
-
81
-
82
-
83
-
84
-
85
-
86
-
87
-
88
-
89
-
90
-
91
-
92
-
93
-
94
-
95
-
96
-
97
-
98
-
99
-
100
-
101
-
102
-
103
-
104
-
105
-
106
-
107
-
108
-
109
-
110
-
111
-
112
-
113
-
114
-
115
-
116
-
117
-
118
-
119
-
120
-
121
-
122
-
123
-
124
-
125
-
126
-
127
-
 128
128 -
 129
129 -
 130
130 -
 131
131 -
 132
132 -
 133
133 -
 134
134 -
 135
135 -
 136
136 -
 137
137 -
 138
138 -
 139
139 -
 140
140 -
 141
141 -
 142
142 -
 143
143 -
 144
144 -
 145
145 -
 146
146 -
 147
147 -
 148
148 -
149
-
150
-
151
-
152
 |
 |

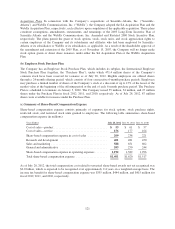
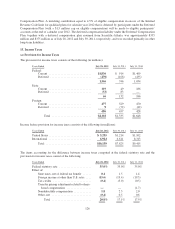
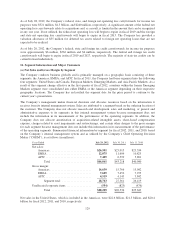
(b) Net Sales for Groups of Similar Products and Services
The Company designs, manufactures, and sells Internet Protocol (“IP”)-based networking and other products
related to the communications and IT industry and provides services associated with these products and their use.
The Company formerly grouped its products and technologies into categories of Switches, Routers, New
Products, and Other. Effective in the first quarter of fiscal 2012, the Company recategorized its products and
technologies into the following categories: Switching, NGN Routing, Collaboration, Service Provider Video,
Wireless, Security, Data Center, and Other Products. These products, primarily integrated by Cisco IOS
Software, link geographically dispersed local-area networks (“LANs”), metropolitan-area networks (“MANs”),
and wide-area networks (“WANs”). The Company has reclassified the prior periods to conform to the current
year’s presentation.
The following table presents net sales for groups of similar products and services (in millions):
Years Ended July 28, 2012 July 30, 2011 July 31, 2010
Net sales:
Switching ........................... $14,531 $14,130 $14,074
NGN Routing ........................ 8,425 8,264 7,868
Collaboration ........................ 4,139 4,013 2,981
Service Provider Video ................. 3,858 3,483 3,294
Wireless ............................ 1,699 1,427 1,134
Security ............................. 1,349 1,200 1,302
Data Center .......................... 1,298 694 196
Other ............................... 1,027 1,315 1,571
Product ......................... 36,326 34,526 32,420
Service ......................... 9,735 8,692 7,620
Total ....................... $46,061 $43,218 $40,040
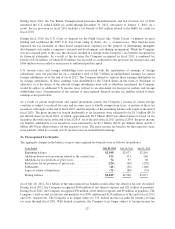
(c) Additional Segment Information
The majority of the Company’s assets, excluding cash and cash equivalents and investments, as of July 28, 2012
and July 30, 2011 were attributable to its U.S. operations. The Company’s total cash and cash equivalents and
investments held by various foreign subsidiaries were $42.5 billion and $39.8 billion as of July 28, 2012 and
July 30, 2011, respectively, and the remaining $6.2 billion and $4.8 billion at the respective fiscal year ends was
available in the United States. In fiscal 2012, 2011, and 2010, no single customer accounted for 10% or more of
the Company’s net sales.
Property and equipment information is based on the physical location of the assets. The following table presents
property and equipment information for geographic areas (in millions):
July 28, 2012 July 30, 2011 July 31, 2010
Property and equipment, net:
United States ......................... $2,842 $3,284 $3,283
International ......................... 560 632 658
Total ........................... $3,402 $3,916 $3,941
130