Cisco 2012 Annual Report Download - page 73
Download and view the complete annual report
Please find page 73 of the 2012 Cisco annual report below. You can navigate through the pages in the report by either clicking on the pages listed below, or by using the keyword search tool below to find specific information within the annual report.-
 1
1 -
2
-
3
-
4
-
5
-
6
-
7
-
8
-
9
-
10
-
11
-
12
-
13
-
14
-
15
-
16
-
17
-
18
-
19
-
20
-
21
-
22
-
23
-
24
-
25
-
26
-
27
-
28
-
29
-
30
-
31
-
32
-
33
-
34
-
35
-
36
-
37
-
38
-
39
-
40
-
41
-
42
-
43
-
44
-
45
-
46
-
47
-
48
-
49
-
50
-
51
-
52
-
53
-
54
-
55
-
56
-
57
-
58
-
59
-
60
-
61
-
62
-
 63
63 -
 64
64 -
 65
65 -
 66
66 -
 67
67 -
 68
68 -
 69
69 -
 70
70 -
 71
71 -
 72
72 -
 73
73 -
 74
74 -
 75
75 -
 76
76 -
 77
77 -
 78
78 -
 79
79 -
 80
80 -
 81
81 -
 82
82 -
 83
83 -
84
-
85
-
86
-
87
-
88
-
89
-
90
-
91
-
92
-
93
-
94
-
95
-
96
-
97
-
98
-
99
-
100
-
101
-
102
-
103
-
104
-
105
-
106
-
107
-
108
-
109
-
110
-
111
-
112
-
113
-
114
-
115
-
116
-
117
-
118
-
119
-
120
-
121
-
122
-
123
-
124
-
125
-
126
-
127
-
128
-
129
-
130
-
131
-
132
-
133
-
134
-
135
-
136
-
137
-
138
-
139
-
140
-
141
-
142
-
143
-
144
-
145
-
146
-
147
-
148
-
149
-
150
-
151
-
152
 |
 |

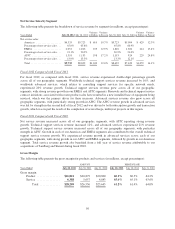
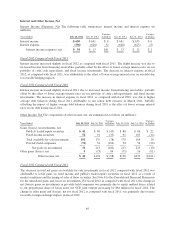
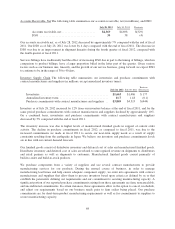
Interest and Other Income, Net
Interest Income (Expense), Net The following table summarizes interest income and interest expense (in
millions):
Years Ended July 28, 2012 July 30, 2011
Variance
in Dollars July 30, 2011 July 31, 2010
Variance
in Dollars
Interest income ................... $ 650 $ 641 $ 9 $ 641 $ 635 $ 6
Interest expense .................. (596) (628) 32 (628) (623) (5)
Interest income (expense), net . . . $54 $ 13 $41 $ 13 $ 12 $ 1
Fiscal 2012 Compared with Fiscal 2011
Interest income increased slightly in fiscal 2012 as compared with fiscal 2011. The slight increase was due to
increased income from financing receivables, partially offset by the effect of lower average interest rates on our
portfolio of cash, cash equivalents, and fixed income investments. The decrease in interest expense in fiscal
2012, as compared with fiscal 2011, was attributable to the effect of lower average interest rates on our debt due
to favorable hedging impacts.
Fiscal 2011 Compared with Fiscal 2010
Interest income increased slightly in fiscal 2011 due to increased income from financing receivables, partially
offset by the effect of lower average interest rates on our portfolio of cash, cash equivalents, and fixed income
investments. The increase in interest expense in fiscal 2011, as compared with fiscal 2010, was due to higher
average debt balances during fiscal 2011 attributable to our senior debt issuance in March 2011. Partially
offsetting the impact of higher average debt balances during fiscal 2011 is the effect of lower average interest
rates on our debt during fiscal 2011.
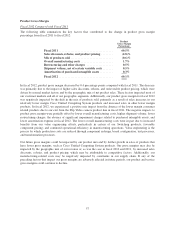
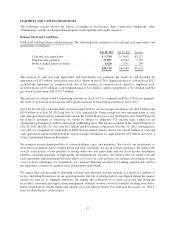
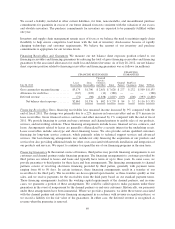
Other Income, Net The components of other income, net, are summarized as follows (in millions):
Years Ended July 28, 2012 July 30, 2011
Variance
in Dollars July 30, 2011 July 31, 2010
Variance
in Dollars
Gains (losses) on investments, net:
Publicly traded equity securities ...... $43 $ 88 $ (45) $ 88 $ 66 $ 22
Fixed income securities ............ 58 91 (33) 91 103 (12)
Total available-for-sale investments . . . 101 179 (78) 179 169 10
Privately held companies ........... (70) 34 (104) 34 54 (20)
Net gains on investments ....... 31 213 (182) 213 223 (10)
Other gains (losses), net ................ 9(75) 84 (75) 16 (91)
Other income, net ......... $40 $138 $ (98) $138 $239 $(101)
Fiscal 2012 Compared with Fiscal 2011
The decrease in total net gains on available-for-sale investments in fiscal 2012 compared with fiscal 2011 was
attributable to lower gains on fixed income and publicly traded equity securities in fiscal 2012 as a result of
market conditions and the timing of sales of these securities. See Note 8 to the Consolidated Financial Statements
for the unrealized gains and losses on investments. For fiscal 2012 as compared with fiscal 2011, the change in
net (losses) gains on investments in privately held companies was primarily due to equity method losses related
to our proportional share of losses from our VCE joint venture increasing by $84 million for fiscal 2012. The
change in other gains and (losses), net for fiscal 2012 as compared with fiscal 2011, was primarily due to more
favorable foreign exchange impacts in fiscal 2012.
65