Cisco 2012 Annual Report Download - page 137
Download and view the complete annual report
Please find page 137 of the 2012 Cisco annual report below. You can navigate through the pages in the report by either clicking on the pages listed below, or by using the keyword search tool below to find specific information within the annual report.-
 1
1 -
2
-
3
-
4
-
5
-
6
-
7
-
8
-
9
-
10
-
11
-
12
-
13
-
14
-
15
-
16
-
17
-
18
-
19
-
20
-
21
-
22
-
23
-
24
-
25
-
26
-
27
-
28
-
29
-
30
-
31
-
32
-
33
-
34
-
35
-
36
-
37
-
38
-
39
-
40
-
41
-
42
-
43
-
44
-
45
-
46
-
47
-
48
-
49
-
50
-
51
-
52
-
53
-
54
-
55
-
56
-
57
-
58
-
59
-
60
-
61
-
62
-
63
-
64
-
65
-
66
-
67
-
68
-
69
-
70
-
71
-
72
-
73
-
74
-
75
-
76
-
77
-
78
-
79
-
80
-
81
-
82
-
83
-
84
-
85
-
86
-
87
-
88
-
89
-
90
-
91
-
92
-
93
-
94
-
95
-
96
-
97
-
98
-
99
-
100
-
101
-
102
-
103
-
104
-
105
-
106
-
107
-
108
-
109
-
110
-
111
-
112
-
113
-
114
-
115
-
116
-
117
-
118
-
119
-
120
-
121
-
122
-
123
-
124
-
125
-
126
-
 127
127 -
 128
128 -
 129
129 -
 130
130 -
 131
131 -
 132
132 -
 133
133 -
 134
134 -
 135
135 -
 136
136 -
 137
137 -
 138
138 -
 139
139 -
 140
140 -
 141
141 -
 142
142 -
 143
143 -
 144
144 -
 145
145 -
 146
146 -
 147
147 -
148
-
149
-
150
-
151
-
152
 |
 |

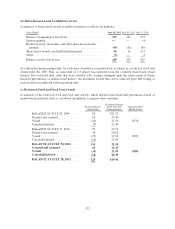
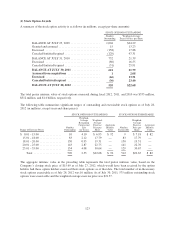
As of July 28, 2012, the Company’s federal, state, and foreign net operating loss carryforwards for income tax
purposes were $321 million, $1.5 billion, and $240 million, respectively. A significant amount of the federal net
operating loss carryforwards relate to acquisitions and, as a result, is limited in the amount that can be recognized
in any one year. If not utilized, the federal net operating loss will begin to expire in fiscal 2019 and the foreign
and state net operating loss carryforwards will begin to expire in fiscal 2013. The Company has provided a
valuation allowance of $55 million for deferred tax assets related to foreign net operating losses that are not
expected to be realized.
As of July 28, 2012, the Company’s federal, state and foreign tax credit carryforwards for income tax purposes
were approximately $6 million, $562 million and $4 million, respectively. The federal and foreign tax credit
carryforwards will begin to expire in fiscal 2019 and 2027, respectively. The majority of state tax credits can be
carried forward indefinitely.
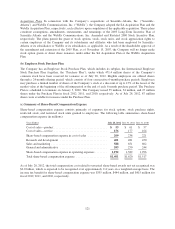
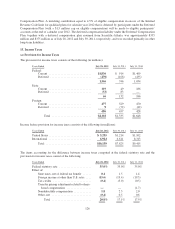
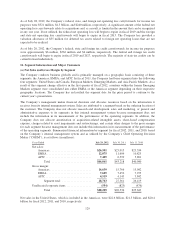
16. Segment Information and Major Customers
(a) Net Sales and Gross Margin by Segment
The Company conducts business globally and is primarily managed on a geographic basis consisting of three
segments: the Americas; EMEA; and APJC. In fiscal 2011, the Company had been organized into the following
four segments: United States and Canada, European Markets, Emerging Markets, and Asia Pacific Markets. As a
result of this segment change effective in the first quarter of fiscal 2012, countries within the former Emerging
Markets segment were consolidated into either EMEA or the Americas segment depending on their respective
geographic locations. The Company has reclassified the segment data for the prior period to conform to the
current year’s presentation.
The Company’s management makes financial decisions and allocates resources based on the information it
receives from its internal management system. Sales are attributed to a segment based on the ordering location of
the customer. The Company does not allocate research and development, sales and marketing, or general and
administrative expenses to its segments in this internal management system because management does not
include the information in its measurement of the performance of the operating segments. In addition, the
Company does not allocate amortization of acquisition-related intangible assets, share-based compensation
expense, charges related to asset impairments and restructurings, and certain other charges to the gross margin
for each segment because management does not include this information in its measurement of the performance
of the operating segments. Summarized financial information by segment for fiscal 2012, 2011, and 2010, based
on the Company’s internal management system and as utilized by the Company’s Chief Operating Decision
Maker (“CODM”), is as follows (in millions):
Years Ended July 28, 2012 July 30, 2011 July 31, 2010
Net sales:
Americas ............................ $26,501 $25,015 $23,334
EMEA .............................. 12,075 11,604 10,825
APJC ............................... 7,485 6,599 5,881
Total ........................... $46,061 $43,218 $40,040
Gross margin:
Americas ............................ 16,639 15,766 15,042
EMEA .............................. 7,605 7,452 7,235
APJC ............................... 4,519 4,143 3,842
Segment total .................... 28,763 27,361 26,119
Unallocated corporate items ................. (554) (825) (476)
Total ........................... $28,209 $26,536 $25,643
Net sales in the United States, which is included in the Americas, were $22.6 billion, $21.5 billion, and $20.4
billion for fiscal 2012, 2011, and 2010, respectively.
129