Cisco 2012 Annual Report Download - page 71
Download and view the complete annual report
Please find page 71 of the 2012 Cisco annual report below. You can navigate through the pages in the report by either clicking on the pages listed below, or by using the keyword search tool below to find specific information within the annual report.-
 1
1 -
2
-
3
-
4
-
5
-
6
-
7
-
8
-
9
-
10
-
11
-
12
-
13
-
14
-
15
-
16
-
17
-
18
-
19
-
20
-
21
-
22
-
23
-
24
-
25
-
26
-
27
-
28
-
29
-
30
-
31
-
32
-
33
-
34
-
35
-
36
-
37
-
38
-
39
-
40
-
41
-
42
-
43
-
44
-
45
-
46
-
47
-
48
-
49
-
50
-
51
-
52
-
53
-
54
-
55
-
56
-
57
-
58
-
59
-
60
-
 61
61 -
 62
62 -
 63
63 -
 64
64 -
 65
65 -
 66
66 -
 67
67 -
 68
68 -
 69
69 -
 70
70 -
 71
71 -
 72
72 -
 73
73 -
 74
74 -
 75
75 -
 76
76 -
 77
77 -
 78
78 -
 79
79 -
 80
80 -
 81
81 -
82
-
83
-
84
-
85
-
86
-
87
-
88
-
89
-
90
-
91
-
92
-
93
-
94
-
95
-
96
-
97
-
98
-
99
-
100
-
101
-
102
-
103
-
104
-
105
-
106
-
107
-
108
-
109
-
110
-
111
-
112
-
113
-
114
-
115
-
116
-
117
-
118
-
119
-
120
-
121
-
122
-
123
-
124
-
125
-
126
-
127
-
128
-
129
-
130
-
131
-
132
-
133
-
134
-
135
-
136
-
137
-
138
-
139
-
140
-
141
-
142
-
143
-
144
-
145
-
146
-
147
-
148
-
149
-
150
-
151
-
152
 |
 |

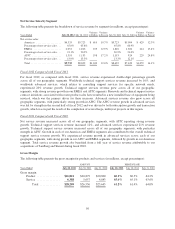
Headcount
Fiscal 2012 Compared with Fiscal 2011
Our headcount decreased by 5,186 employees in fiscal 2012. The decrease was attributable to headcount
reductions from the completion of the sale of our Juarez, Mexico manufacturing operations and from our
restructuring actions initiated in July 2011. Partially offsetting these declines in headcount were headcount
increases due to the growth of our service business and targeted hiring in engineering, which includes the hiring
of recent university graduates.
Fiscal 2011 Compared with Fiscal 2010
For fiscal 2011, our headcount increased by 1,111 employees, the increase being attributable to targeted hiring as
part of our investment in growth initiatives, partially offset by the impacts of our voluntary early retirement
program and our restructuring activities, which began to reduce our headcount in late fiscal 2011.
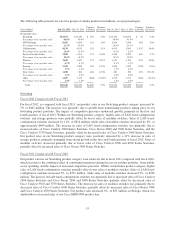
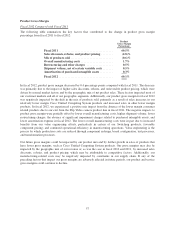
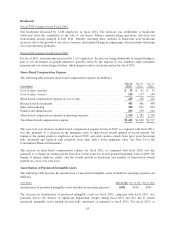
Share-Based Compensation Expense
The following table presents share-based compensation expense (in millions):
Years Ended
July 28,
2012
July 30,
2011
July 31,
2010
Cost of sales—product .................................................. $53$61$57
Cost of sales—service .................................................. 156 177 164
Share-based compensation expense in cost of sales ........................... 209 238 221
Research and development ............................................... 401 481 450
Sales and marketing .................................................... 588 651 602
General and administrative .............................................. 203 250 244
Share-based compensation expense in operating expenses ...................... 1,192 1,382 1,296
Total share-based compensation expense ................................... $1,401 $1,620 $1,517
The year-over-year decrease in share-based compensation expense for fiscal 2012, as compared with fiscal 2011,
was due primarily to a decrease in the aggregate value of share-based awards granted in recent periods, the
timing of the annual grants to employees in fiscal 2012, and stock options awards from prior years becoming
fully amortized and replaced with restricted stock units with a lower aggregate value. See Note 14 to the
Consolidated Financial Statements.
The increase in share-based compensation expense for fiscal 2011, as compared with fiscal 2010, was due
primarily to a change in vesting periods from five to four years for awards granted beginning in fiscal 2009, the
timing of annual employee grants, and the overall growth in headcount and number of share-based awards
granted on a year-over-year basis.
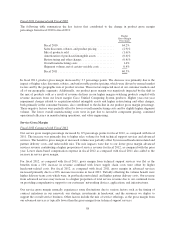
Amortization of Purchased Intangible Assets
The following table presents the amortization of purchased intangible assets included in operating expenses (in
millions):
Years Ended July 28, 2012 July 30, 2011 July 31, 2010
Amortization of purchased intangible assets included in operating expenses . . . $383 $520 $491
The decrease in amortization of purchased intangible assets for fiscal 2012, compared with fiscal 2011, was
primarily due to the absence of significant impairment charges during fiscal 2012 and also due to certain
purchased intangible assets having become fully amortized or impaired in fiscal 2011. For fiscal 2011, as
63