Cisco 2012 Annual Report Download - page 113
Download and view the complete annual report
Please find page 113 of the 2012 Cisco annual report below. You can navigate through the pages in the report by either clicking on the pages listed below, or by using the keyword search tool below to find specific information within the annual report.-
 1
1 -
2
-
3
-
4
-
5
-
6
-
7
-
8
-
9
-
10
-
11
-
12
-
13
-
14
-
15
-
16
-
17
-
18
-
19
-
20
-
21
-
22
-
23
-
24
-
25
-
26
-
27
-
28
-
29
-
30
-
31
-
32
-
33
-
34
-
35
-
36
-
37
-
38
-
39
-
40
-
41
-
42
-
43
-
44
-
45
-
46
-
47
-
48
-
49
-
50
-
51
-
52
-
53
-
54
-
55
-
56
-
57
-
58
-
59
-
60
-
61
-
62
-
63
-
64
-
65
-
66
-
67
-
68
-
69
-
70
-
71
-
72
-
73
-
74
-
75
-
76
-
77
-
78
-
79
-
80
-
81
-
82
-
83
-
84
-
85
-
86
-
87
-
88
-
89
-
90
-
91
-
92
-
93
-
94
-
95
-
96
-
97
-
98
-
99
-
100
-
101
-
102
-
 103
103 -
 104
104 -
 105
105 -
 106
106 -
 107
107 -
 108
108 -
 109
109 -
 110
110 -
 111
111 -
 112
112 -
 113
113 -
 114
114 -
 115
115 -
 116
116 -
 117
117 -
 118
118 -
 119
119 -
 120
120 -
 121
121 -
 122
122 -
 123
123 -
124
-
125
-
126
-
127
-
128
-
129
-
130
-
131
-
132
-
133
-
134
-
135
-
136
-
137
-
138
-
139
-
140
-
141
-
142
-
143
-
144
-
145
-
146
-
147
-
148
-
149
-
150
-
151
-
152
 |
 |

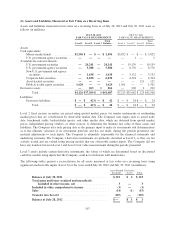
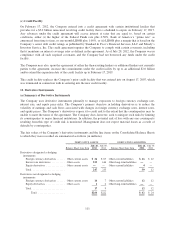
UNREALIZED LOSSES
LESS THAN 12 MONTHS
UNREALIZED LOSSES
12 MONTHS OR GREATER TOTAL
July 30, 2011 Fair Value
Gross
Unrealized
Losses Fair Value
Gross
Unrealized
Losses Fair Value
Gross
Unrealized
Losses
Fixed income securities:
U.S. government agency securities ..... $2,310 $ (1) $ — $ — $2,310 $ (1)
Non-U.S. government and agency
securities ........................ 875 (1) — — 875 (1)
Corporate debt securities .............. 548 (2) 56 (2) 604 (4)
Asset-backed securities ............... — — 105 (4) 105 (4)
Total fixed income securities ...... 3,733 (4) 161 (6) 3,894 (10)
Publicly traded equity securities ............ 112 (12) — — 112 (12)
Total ..................... $3,845 $ (16) $ 161 $ (6) $4,006 $(22)
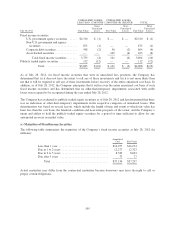
As of July 28, 2012, for fixed income securities that were in unrealized loss positions, the Company has
determined that (i) it does not have the intent to sell any of these investments and (ii) it is not more likely than
not that it will be required to sell any of these investments before recovery of the entire amortized cost basis. In
addition, as of July 28, 2012, the Company anticipates that it will recover the entire amortized cost basis of such
fixed income securities and has determined that no other-than-temporary impairments associated with credit
losses were required to be recognized during the year ended July 28, 2012.
The Company has evaluated its publicly traded equity securities as of July 28, 2012 and has determined that there
was no indication of other-than-temporary impairments in the respective categories of unrealized losses. This
determination was based on several factors, which include the length of time and extent to which fair value has
been less than the cost basis, the financial condition and near-term prospects of the issuer, and the Company’s
intent and ability to hold the publicly traded equity securities for a period of time sufficient to allow for any
anticipated recovery in market value.
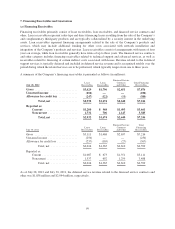
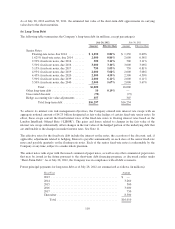
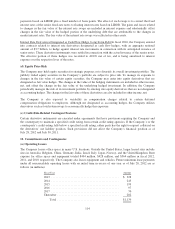
(c) Maturities of Fixed Income Securities
The following table summarizes the maturities of the Company’s fixed income securities at July 28, 2012 (in
millions):
Amortized
Cost Fair Value
Less than 1 year .................................. $16,257 $16,274
Due in 1 to 2 years ................................ 12,277 12,323
Due in 2 to 5 years ................................ 8,549 8,623
Due after 5 years ................................. 73 77
Total ....................................... $37,156 $37,297
Actual maturities may differ from the contractual maturities because borrowers may have the right to call or
prepay certain obligations.
105