Cisco 2012 Annual Report Download - page 79
Download and view the complete annual report
Please find page 79 of the 2012 Cisco annual report below. You can navigate through the pages in the report by either clicking on the pages listed below, or by using the keyword search tool below to find specific information within the annual report.-
 1
1 -
2
-
3
-
4
-
5
-
6
-
7
-
8
-
9
-
10
-
11
-
12
-
13
-
14
-
15
-
16
-
17
-
18
-
19
-
20
-
21
-
22
-
23
-
24
-
25
-
26
-
27
-
28
-
29
-
30
-
31
-
32
-
33
-
34
-
35
-
36
-
37
-
38
-
39
-
40
-
41
-
42
-
43
-
44
-
45
-
46
-
47
-
48
-
49
-
50
-
51
-
52
-
53
-
54
-
55
-
56
-
57
-
58
-
59
-
60
-
61
-
62
-
63
-
64
-
65
-
66
-
67
-
68
-
 69
69 -
 70
70 -
 71
71 -
 72
72 -
 73
73 -
 74
74 -
 75
75 -
 76
76 -
 77
77 -
 78
78 -
 79
79 -
 80
80 -
 81
81 -
 82
82 -
 83
83 -
 84
84 -
 85
85 -
 86
86 -
 87
87 -
 88
88 -
 89
89 -
90
-
91
-
92
-
93
-
94
-
95
-
96
-
97
-
98
-
99
-
100
-
101
-
102
-
103
-
104
-
105
-
106
-
107
-
108
-
109
-
110
-
111
-
112
-
113
-
114
-
115
-
116
-
117
-
118
-
119
-
120
-
121
-
122
-
123
-
124
-
125
-
126
-
127
-
128
-
129
-
130
-
131
-
132
-
133
-
134
-
135
-
136
-
137
-
138
-
139
-
140
-
141
-
142
-
143
-
144
-
145
-
146
-
147
-
148
-
149
-
150
-
151
-
152
 |
 |

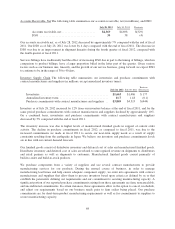
Deferred Revenue The following table presents the breakdown of deferred revenue (in millions):
July 28, 2012 July 30, 2011
Increase
(Decrease)
Service ................................... $ 9,173 $ 8,521 $ 652
Product ................................... 3,707 3,686 21
Total ............................. $12,880 $12,207 $ 673
Reported as:
Current ............................... $ 8,852 $ 8,025 $ 827
Noncurrent ............................ 4,028 4,182 (154)
Total ............................. $12,880 $12,207 $ 673
The 8% increase in deferred service revenue in fiscal 2012 reflects the impact of new contract initiations and
renewals, partially offset by the ongoing amortization of deferred service revenue. The slight increase in deferred
product revenue was due to increased deferrals related to subscription revenue arrangements and, to a lesser
extent, higher two-tier deferred revenue which was due to improved shipment linearity to two-tier partners during
the fourth quarter of fiscal 2012. This increase was partially offset by decreased deferred revenue related to our
financing arrangements.
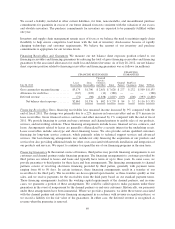
Contractual Obligations
The impact of contractual obligations on our liquidity and capital resources in future periods should be analyzed
in conjunction with the factors that impact our cash flows from operations discussed previously. In addition, we
plan for and measure our liquidity and capital resources through an annual budgeting process. The following
table summarizes our contractual obligations at July 28, 2012 (in millions):
PAYMENTS DUE BY PERIOD
July 28, 2012 Total
Less than
1 Year
1to3
Years
3to5
Years
More than
5 Years
Operating leases ............................................. $ 1,139 $ 328 $ 442 $ 167 $ 202
Purchase commitments with contract manufacturers and suppliers ...... 3,869 3,869 — — —
Other purchase obligations ..................................... 1,460 501 808 151 —
Long-term debt .............................................. 16,010 — 3,760 3,750 8,500
Other long-term liabilities ..................................... 425 — 88 40 297
Total by period .......................................... $22,903 $4,698 $5,098 $4,108 $8,999
Other long-term liabilities (uncertainty in the timing of future payments) . . . 1,977
Total .............................................. $24,880
Operating Leases For more information on our operating leases, see Note 12 to the Consolidated Financial
Statements.
Purchase Commitments with Contract Manufacturers and Suppliers We purchase components from a variety of
suppliers and use several contract manufacturers to provide manufacturing services for our products. A
significant portion of our reported estimated purchase commitments arising from these agreements are firm,
noncancelable, and unconditional commitments. We record a liability for firm, noncancelable, and unconditional
purchase commitments for quantities in excess of our future demand forecasts consistent with the valuation of
our excess and obsolete inventory. See further discussion in “Inventory Supply Chain.” As of July 28, 2012, the
liability for these purchase commitments was $193 million and is recorded in other current liabilities and is not
included in the preceding table.
71