Cisco 2012 Annual Report Download - page 106
Download and view the complete annual report
Please find page 106 of the 2012 Cisco annual report below. You can navigate through the pages in the report by either clicking on the pages listed below, or by using the keyword search tool below to find specific information within the annual report.-
 1
1 -
2
-
3
-
4
-
5
-
6
-
7
-
8
-
9
-
10
-
11
-
12
-
13
-
14
-
15
-
16
-
17
-
18
-
19
-
20
-
21
-
22
-
23
-
24
-
25
-
26
-
27
-
28
-
29
-
30
-
31
-
32
-
33
-
34
-
35
-
36
-
37
-
38
-
39
-
40
-
41
-
42
-
43
-
44
-
45
-
46
-
47
-
48
-
49
-
50
-
51
-
52
-
53
-
54
-
55
-
56
-
57
-
58
-
59
-
60
-
61
-
62
-
63
-
64
-
65
-
66
-
67
-
68
-
69
-
70
-
71
-
72
-
73
-
74
-
75
-
76
-
77
-
78
-
79
-
80
-
81
-
82
-
83
-
84
-
85
-
86
-
87
-
88
-
89
-
90
-
91
-
92
-
93
-
94
-
95
-
 96
96 -
 97
97 -
 98
98 -
 99
99 -
 100
100 -
 101
101 -
 102
102 -
 103
103 -
 104
104 -
 105
105 -
 106
106 -
 107
107 -
 108
108 -
 109
109 -
 110
110 -
 111
111 -
 112
112 -
 113
113 -
 114
114 -
 115
115 -
 116
116 -
117
-
118
-
119
-
120
-
121
-
122
-
123
-
124
-
125
-
126
-
127
-
128
-
129
-
130
-
131
-
132
-
133
-
134
-
135
-
136
-
137
-
138
-
139
-
140
-
141
-
142
-
143
-
144
-
145
-
146
-
147
-
148
-
149
-
150
-
151
-
152
 |
 |

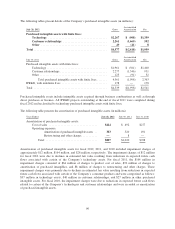
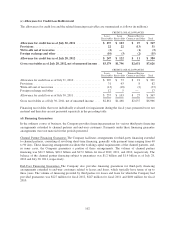
During fiscal 2011, the Company also recorded charges of approximately $124 million, primarily related to
inventory and supply chain charges in connection with restructuring related to the Company’s consumer product
lines, most notably exiting the Flip Video camera product line, which were recorded in cost of sales and not
included in the preceding table.
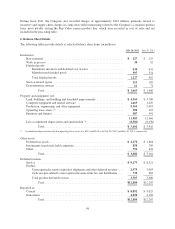
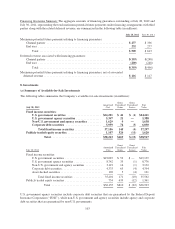
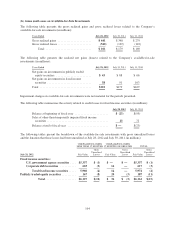
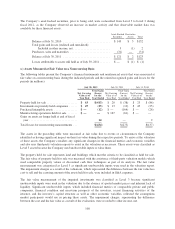
6. Balance Sheet Details
The following tables provide details of selected balance sheet items (in millions):
July 28, 2012 July 30, 2011
Inventories:
Raw materials ...................................................... $ 127 $ 219
Work in process .................................................... 35 52
Finished goods:
Distributor inventory and deferred cost of sales ....................... 630 631
Manufactured finished goods ...................................... 597 331
Total finished goods ............................................. 1,227 962
Service-related spares ............................................... 213 182
Demonstration systems .............................................. 61 71
Total ..................................................... $ 1,663 $ 1,486
Property and equipment, net:
Land, buildings, and building and leasehold improvements .................. $ 4,363 $ 4,760
Computer equipment and related software ............................... 1,469 1,429
Production, engineering, and other equipment ............................ 5,364 5,093
Operating lease assets (1) ............................................. 300 293
Furniture and fixtures ................................................ 487 491
11,983 12,066
Less accumulated depreciation and amortization (1) ........................ (8,581) (8,150)
Total ..................................................... $ 3,402 $ 3,916
(1) Accumulated depreciation related to operating lease assets was $181 and $169 as of July 28, 2012 and July 30, 2011, respectively.
Other assets:
Deferred tax assets .................................................. $ 2,270 $ 1,864
Investments in privately held companies ................................. 858 796
Other ............................................................. 754 441
Total ..................................................... $ 3,882 $ 3,101
Deferred revenue:
Service ........................................................... $ 9,173 $ 8,521
Product:
Unrecognized revenue on product shipments and other deferred revenue . . . 2,975 3,003
Cash receipts related to unrecognized revenue from two-tier distributors . . . 732 683
Total product deferred revenue .................................... 3,707 3,686
Total ..................................................... $12,880 $12,207
Reported as:
Current ........................................................... $ 8,852 $ 8,025
Noncurrent ........................................................ 4,028 4,182
Total ..................................................... $12,880 $12,207
98