Cisco 2012 Annual Report Download - page 59
Download and view the complete annual report
Please find page 59 of the 2012 Cisco annual report below. You can navigate through the pages in the report by either clicking on the pages listed below, or by using the keyword search tool below to find specific information within the annual report.-
 1
1 -
2
-
3
-
4
-
5
-
6
-
7
-
8
-
9
-
10
-
11
-
12
-
13
-
14
-
15
-
16
-
17
-
18
-
19
-
20
-
21
-
22
-
23
-
24
-
25
-
26
-
27
-
28
-
29
-
30
-
31
-
32
-
33
-
34
-
35
-
36
-
37
-
38
-
39
-
40
-
41
-
42
-
43
-
44
-
45
-
46
-
47
-
48
-
 49
49 -
 50
50 -
 51
51 -
 52
52 -
 53
53 -
 54
54 -
 55
55 -
 56
56 -
 57
57 -
 58
58 -
 59
59 -
 60
60 -
 61
61 -
 62
62 -
 63
63 -
 64
64 -
 65
65 -
 66
66 -
 67
67 -
 68
68 -
 69
69 -
70
-
71
-
72
-
73
-
74
-
75
-
76
-
77
-
78
-
79
-
80
-
81
-
82
-
83
-
84
-
85
-
86
-
87
-
88
-
89
-
90
-
91
-
92
-
93
-
94
-
95
-
96
-
97
-
98
-
99
-
100
-
101
-
102
-
103
-
104
-
105
-
106
-
107
-
108
-
109
-
110
-
111
-
112
-
113
-
114
-
115
-
116
-
117
-
118
-
119
-
120
-
121
-
122
-
123
-
124
-
125
-
126
-
127
-
128
-
129
-
130
-
131
-
132
-
133
-
134
-
135
-
136
-
137
-
138
-
139
-
140
-
141
-
142
-
143
-
144
-
145
-
146
-
147
-
148
-
149
-
150
-
151
-
152
 |
 |

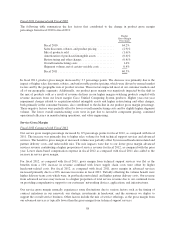
Fiscal 2011 Compared with Fiscal 2010
For fiscal 2011, as compared with fiscal 2010, net sales increased by 8%. Within total net sales growth, net
product sales increased by 6%, while service revenue increased by 14%. Our product and service revenue totals
each reflected sales growth across each of our geographic segments. The sales increase was due to customer
acceptance of the new product transitions taking place in our core switching and routing businesses, sales growth
in our Collaboration, Data Center, Wireless, and Service Provider Video product categories and the strong
performance of our services solutions.
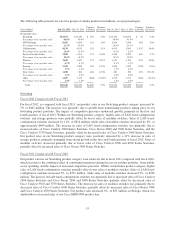
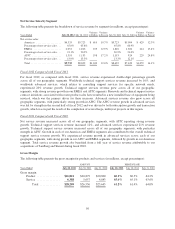
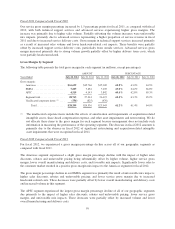
Net Product Sales by Segment
The following table presents the breakdown of net product sales by segment (in millions, except percentages):
Years Ended July 28, 2012 July 30, 2011
Variance
in Dollars
Variance
in Percent July 30, 2011 July 31, 2010
Variance
in Dollars
Variance
in Percent
Net product sales:
Americas .................... $20,168 $19,292 $ 876 4.5% $19,292 $18,240 $1,052 5.8%
Percentage of net product sales ... 55.5% 55.9% 55.9% 56.3%
EMEA ...................... 10,024 9,788 236 2.4% 9,788 9,223 565 6.1%
Percentage of net product sales ... 27.6% 28.3% 28.3% 28.4%
APJC ....................... 6,134 5,446 688 12.6% 5,446 4,957 489 9.9%
Percentage of net product sales ... 16.9% 15.8% 15.8% 15.3%
Total .................. $36,326 $34,526 $1,800 5.2% $34,526 $32,420 $2,106 6.5%
Americas
Fiscal 2012 Compared with Fiscal 2011
For fiscal 2012, as compared with fiscal 2011, net product sales in the Americas segment increased by 5%. The
increase in net product sales was across most of our customer markets in the Americas segment, led by growth in
the enterprise, service provider and commercial markets. We experienced a net product sales decline in the public
sector market for the fiscal year. Within the Americas segment, net product sales to the U.S. public sector were
flat, as lower net product sales to the U.S. federal government were offset by higher net product sales to state and
local government. From a country perspective, net product sales increased by 4% in the United States, 10% in
Canada, 21% in Mexico, and 14% in Brazil.
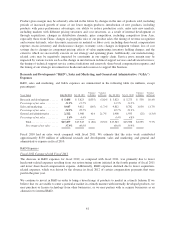
Fiscal 2011 Compared with Fiscal 2010
For fiscal 2011, as compared with fiscal 2010, net product sales in the Americas segment increased by 6%. Net
product sales increased 3% in the United States, 31% in Canada, 20% in Brazil, and 8% in Mexico. The increase
in net product sales was across all of our customer markets in the Americas segment, led by the net product sales
growth in our commercial market, followed by smaller increases in net product sales growth in the service
provider, enterprise, and public sector markets. Net product sales to the U.S. public sector decreased due to a
decrease in sales to the U.S. federal government, while sales to the state and local government market were flat.
EMEA
Fiscal 2012 Compared with Fiscal 2011
For fiscal 2012, as compared with fiscal 2011, net product sales in the EMEA segment increased by 2%. The
increase in net product sales was across most of our customer markets in the EMEA segment, led by growth in
the commercial, enterprise and public sector markets. We experienced a slight decline in net product sales in the
service provider customer market during the fiscal year driven by lower revenue from this customer market in
several of the large countries in the region. From a country perspective, net product sales increased by 11% in the
United Kingdom, 15% in Russia, and 9% in the Netherlands. These increases were partially offset by net product
sales declines of 23% in Italy, 21% in Spain, 2% in Germany, and 1% in France.
51