Cisco 2012 Annual Report Download - page 52
Download and view the complete annual report
Please find page 52 of the 2012 Cisco annual report below. You can navigate through the pages in the report by either clicking on the pages listed below, or by using the keyword search tool below to find specific information within the annual report.-
 1
1 -
2
-
3
-
4
-
5
-
6
-
7
-
8
-
9
-
10
-
11
-
12
-
13
-
14
-
15
-
16
-
17
-
18
-
19
-
20
-
21
-
22
-
23
-
24
-
25
-
26
-
27
-
28
-
29
-
30
-
31
-
32
-
33
-
34
-
35
-
36
-
37
-
38
-
39
-
40
-
41
-
 42
42 -
 43
43 -
 44
44 -
 45
45 -
 46
46 -
 47
47 -
 48
48 -
 49
49 -
 50
50 -
 51
51 -
 52
52 -
 53
53 -
 54
54 -
 55
55 -
 56
56 -
 57
57 -
 58
58 -
 59
59 -
 60
60 -
 61
61 -
 62
62 -
63
-
64
-
65
-
66
-
67
-
68
-
69
-
70
-
71
-
72
-
73
-
74
-
75
-
76
-
77
-
78
-
79
-
80
-
81
-
82
-
83
-
84
-
85
-
86
-
87
-
88
-
89
-
90
-
91
-
92
-
93
-
94
-
95
-
96
-
97
-
98
-
99
-
100
-
101
-
102
-
103
-
104
-
105
-
106
-
107
-
108
-
109
-
110
-
111
-
112
-
113
-
114
-
115
-
116
-
117
-
118
-
119
-
120
-
121
-
122
-
123
-
124
-
125
-
126
-
127
-
128
-
129
-
130
-
131
-
132
-
133
-
134
-
135
-
136
-
137
-
138
-
139
-
140
-
141
-
142
-
143
-
144
-
145
-
146
-
147
-
148
-
149
-
150
-
151
-
152
 |
 |

As our business and offerings evolve over time, our pricing practices may be required to be modified
accordingly, which could result in changes in selling prices, including both VSOE and ESP, in subsequent
periods. There were no material impacts during fiscal 2012, nor do we currently expect a material impact in fiscal
2013 on our revenue recognition due to any changes in our VSOE, TPE, or ESP.
Revenue deferrals relate to the timing of revenue recognition for specific transactions based on financing
arrangements, service, support, and other factors. Financing arrangements may include sales-type, direct-
financing, and operating leases, loans, and guarantees of third-party financing. Our deferred revenue for products
was $3.7 billion as of each July 28, 2012 and July 30, 2011. Technical support services revenue is deferred and
recognized ratably over the period during which the services are to be performed, which typically is from one to
three years. Advanced services revenue is recognized upon delivery or completion of performance. Our deferred
revenue for services was $9.2 billion and $8.5 billion as of July 28, 2012 and July 30, 2011, respectively.
We make sales to distributors and retail partners which we refer to as two-tier systems of sales to the end
customer. Revenue from distributors and retail partners is recognized based on a sell-through method using
information provided by them. Our distributors and retail partners participate in various cooperative marketing
and other programs, and we maintain estimated accruals and allowances for these programs. If actual credits
received by our distributors and retail partners under these programs were to deviate significantly from our
estimates, which are based on historical experience, our revenue could be adversely affected.
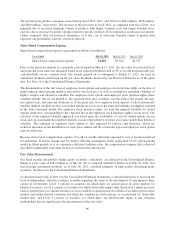
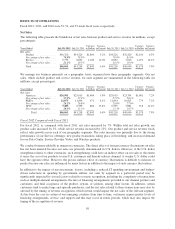
Allowances for Receivables and Sales Returns
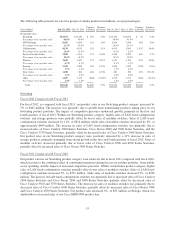
The allowances for receivables were as follows (in millions, except percentages):
July 28, 2012 July 30, 2011
Allowance for doubtful accounts ................. $207 $204
Percentage of gross accounts receivable ........... 4.5% 4.2%
Allowance for credit loss—lease receivables ....... $247 $237
Percentage of gross lease receivables ............. 7.2% 7.6%
Allowance for credit loss—loan receivables ........ $122 $103
Percentage of gross loan receivables ............. 6.8% 7.0%
The allowance for doubtful accounts is based on our assessment of the collectibility of customer accounts. We
regularly review the adequacy of these allowances by considering internal factors such as historical experience,
credit quality and age of the receivable balances as well as external factors such as economic conditions that may
affect a customer’s ability to pay and expected default frequency rates, which are published by major third-party
credit-rating agencies and are generally updated on a quarterly basis. We also consider the concentration of
receivables outstanding with a particular customer in assessing the adequacy of our allowances for doubtful
accounts. If a major customer’s creditworthiness deteriorates, if actual defaults are higher than our historical
experience, or if other circumstances arise, our estimates of the recoverability of amounts due to us could be
overstated, and additional allowances could be required, which could have an adverse impact on our revenue.
The allowance for credit loss on financing receivables is also based on the assessment of collectibility of
customer accounts. We regularly review the adequacy of the credit allowances determined either on an individual
or a collective basis. When evaluating the financing receivables on an individual basis, we consider historical
experience, credit quality and age of receivable balances, and economic conditions that may affect a customer’s
ability to pay. As discussed in Note 7 to the Consolidated Financial Statements, effective at the beginning of the
second quarter of fiscal 2012 we refined our methodology for determining the portion of our allowance for credit
loss that is evaluated on a collective basis. The refinement consists of more systematically giving effect to
economic conditions, concentration of risk and correlation. We also began to use expected default frequency
rates published by a major third-party credit-rating agency as well as our own historical loss rate in the event of
default. Determination of expected default frequency rates and loss factors associated with internal credit risk
44