Cisco 2012 Annual Report Download - page 49
Download and view the complete annual report
Please find page 49 of the 2012 Cisco annual report below. You can navigate through the pages in the report by either clicking on the pages listed below, or by using the keyword search tool below to find specific information within the annual report.-
 1
1 -
2
-
3
-
4
-
5
-
6
-
7
-
8
-
9
-
10
-
11
-
12
-
13
-
14
-
15
-
16
-
17
-
18
-
19
-
20
-
21
-
22
-
23
-
24
-
25
-
26
-
27
-
28
-
29
-
30
-
31
-
32
-
33
-
34
-
35
-
36
-
37
-
38
-
 39
39 -
 40
40 -
 41
41 -
 42
42 -
 43
43 -
 44
44 -
 45
45 -
 46
46 -
 47
47 -
 48
48 -
 49
49 -
 50
50 -
 51
51 -
 52
52 -
 53
53 -
 54
54 -
 55
55 -
 56
56 -
 57
57 -
 58
58 -
 59
59 -
60
-
61
-
62
-
63
-
64
-
65
-
66
-
67
-
68
-
69
-
70
-
71
-
72
-
73
-
74
-
75
-
76
-
77
-
78
-
79
-
80
-
81
-
82
-
83
-
84
-
85
-
86
-
87
-
88
-
89
-
90
-
91
-
92
-
93
-
94
-
95
-
96
-
97
-
98
-
99
-
100
-
101
-
102
-
103
-
104
-
105
-
106
-
107
-
108
-
109
-
110
-
111
-
112
-
113
-
114
-
115
-
116
-
117
-
118
-
119
-
120
-
121
-
122
-
123
-
124
-
125
-
126
-
127
-
128
-
129
-
130
-
131
-
132
-
133
-
134
-
135
-
136
-
137
-
138
-
139
-
140
-
141
-
142
-
143
-
144
-
145
-
146
-
147
-
148
-
149
-
150
-
151
-
152
 |
 |
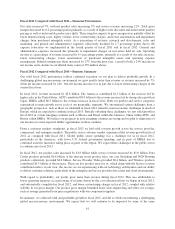
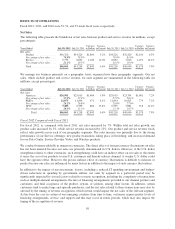
Fiscal 2012 Compared with Fiscal 2011—Financial Performance
Net sales increased 7%, with net product sales increasing 5% and service revenue increasing 12%. Total gross
margin decreased by 0.2 percentage points primarily as a result of higher sales discounts and unfavorable product
pricing as well as unfavorable product mix shifts. These negative impacts to gross margin were partially offset by
lower manufacturing costs, higher volume, lower restructuring charges, and lower amortization and impairment
charges from purchased intangible assets. As a percentage of revenue, research and development, sales and
marketing, and general and administrative expenses collectively declined by 2.7 percentage points due to the
expense reductions we implemented in the fourth quarter of fiscal 2011 and in fiscal 2012. General and
administrative expenses increased due primarily to impairment charges on real estate held for sale. Operating
income as a percentage of revenue increased by 4.1 percentage points, primarily as a result of our sales increase,
lower restructuring charges, lower amortization of purchased intangible assets and operating expense
management. Diluted earnings per share increased by 27% from the prior year, a result of both a 24% increase in
net income and a decline in our diluted share count of 159 million shares.
Fiscal 2012 Compared with Fiscal 2011—Business Summary
Our solid fiscal 2012 performance reflects continued execution on our plan to deliver profitable growth. In a
challenging global macroeconomic environment we grew profits faster than revenue as revenue increased by 7%
while net income increased by 24%. Our net income increase was in part due to lower restructuring charges in the
current fiscal year.
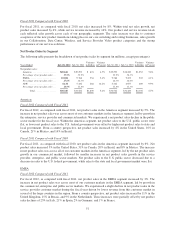
In fiscal 2012, revenue increased by $2.8 billion. The Americas contributed $1.5 billion of the increase led by
higher sales in the United States. APJC contributed $0.9 billion to the revenue increase led by strong sales growth in
Japan. EMEA added $0.5 billion to the revenue increase in fiscal 2012. Both our product and service categories
experienced revenue growth across each of our geographic segments. We encountered certain challenges from a
geographic perspective, such as those we identified in fiscal 2012 related to macroeconomic challenges in much of
Europe, which are expected to continue in fiscal 2013. Partially offsetting these challenges, we saw solid growth in
fiscal 2012 in certain emerging countries such as Mexico and Brazil within the Americas, China within APJC, and
Russia within EMEA. We believe our prospects in most emerging countries are strong and we plan to align more of
our resources to meet expected further opportunities in these countries.
From a customer markets standpoint, in fiscal 2012 we had solid revenue growth across the service provider,
commercial, and enterprise markets. The public sector customer market experienced flat revenue growth in fiscal
2012 as compared with fiscal 2011. Global public sector spending was a challenge for us in fiscal 2012,
particularly in the Americas, with lower U.S. federal government spending, and in parts of EMEA due to
continued austerity measures taking place in parts of the region. We expect these challenges in the public sector
to continue into fiscal 2013.
In fiscal 2012, net product sales increased by $1.8 billion while service revenue increased by $1.0 billion. Data
Center products provided $0.6 billion of the increase in net product sales, our core Switching and NGN Routing
products collectively provided $0.6 billion, Service Provider Video provided $0.4 billion, and Wireless products
contributed $0.3 billion of the increase. These are key product areas for us, which along with the Service revenue
contribution reflect, in our view, the success we are experiencing with our technology architectures and our ability
to deliver customer solutions, particularly in the enterprise and service provider data center and cloud environments.
With regard to profitability, our profits grew faster than revenue during fiscal 2012. This was attributable to
lower operating expenses as a percentage of revenue driven by the cost reduction efforts we began in fiscal 2011,
and substantially completed in fiscal 2012, and lower restructuring charges in fiscal 2012, coupled with relative
stability in our gross margin. Our product gross margin benefited from value engineering and other cost savings,
such as savings generated from price negotiations with our component suppliers.
In summary, we achieved solid and profitable growth in fiscal 2012, and did so while encountering a challenging
global macroeconomic environment. We expect that we will continue to be impacted by some of the same
41