Cisco 2012 Annual Report Download - page 111
Download and view the complete annual report
Please find page 111 of the 2012 Cisco annual report below. You can navigate through the pages in the report by either clicking on the pages listed below, or by using the keyword search tool below to find specific information within the annual report.-
 1
1 -
2
-
3
-
4
-
5
-
6
-
7
-
8
-
9
-
10
-
11
-
12
-
13
-
14
-
15
-
16
-
17
-
18
-
19
-
20
-
21
-
22
-
23
-
24
-
25
-
26
-
27
-
28
-
29
-
30
-
31
-
32
-
33
-
34
-
35
-
36
-
37
-
38
-
39
-
40
-
41
-
42
-
43
-
44
-
45
-
46
-
47
-
48
-
49
-
50
-
51
-
52
-
53
-
54
-
55
-
56
-
57
-
58
-
59
-
60
-
61
-
62
-
63
-
64
-
65
-
66
-
67
-
68
-
69
-
70
-
71
-
72
-
73
-
74
-
75
-
76
-
77
-
78
-
79
-
80
-
81
-
82
-
83
-
84
-
85
-
86
-
87
-
88
-
89
-
90
-
91
-
92
-
93
-
94
-
95
-
96
-
97
-
98
-
99
-
100
-
 101
101 -
 102
102 -
 103
103 -
 104
104 -
 105
105 -
 106
106 -
 107
107 -
 108
108 -
 109
109 -
 110
110 -
 111
111 -
 112
112 -
 113
113 -
 114
114 -
 115
115 -
 116
116 -
 117
117 -
 118
118 -
 119
119 -
 120
120 -
 121
121 -
122
-
123
-
124
-
125
-
126
-
127
-
128
-
129
-
130
-
131
-
132
-
133
-
134
-
135
-
136
-
137
-
138
-
139
-
140
-
141
-
142
-
143
-
144
-
145
-
146
-
147
-
148
-
149
-
150
-
151
-
152
 |
 |

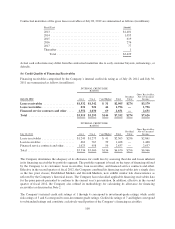
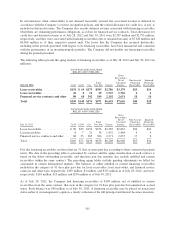
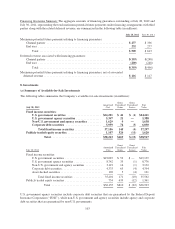
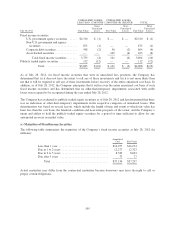
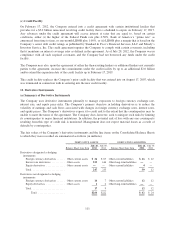
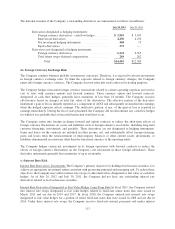
Financing Guarantee Summary The aggregate amounts of financing guarantees outstanding at July 28, 2012 and
July 30, 2011, representing the total maximum potential future payments under financing arrangements with third
parties along with the related deferred revenue, are summarized in the following table (in millions):
July 28, 2012 July 30, 2011
Maximum potential future payments relating to financing guarantees:
Channel partner .................................................... $ 277 $ 336
End user .......................................................... 232 277
Total ......................................................... $ 509 $ 613
Deferred revenue associated with financing guarantees:
Channel partner .................................................... $(193) $(248)
End user .......................................................... (200) (248)
Total ......................................................... $(393) $(496)
Maximum potential future payments relating to financing guarantees, net of associated
deferred revenue ...................................................... $ 116 $ 117
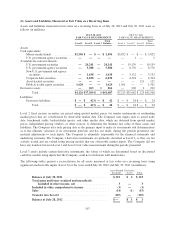
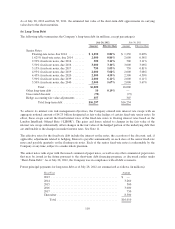
8. Investments
(a) Summary of Available-for-Sale Investments
The following tables summarize the Company’s available-for-sale investments (in millions):
July 28, 2012
Amortized
Cost
Gross
Unrealized
Gains
Gross
Unrealized
Losses
Fair
Value
Fixed income securities:
U.S. government securities ....................... $24,201 $ 41 $ (1) $24,241
U.S. government agency securities ................. 5,367 21 — 5,388
Non-U.S. government and agency securities ......... 1,629 9 — 1,638
Corporate debt securities ........................ 5,959 74 (3) 6,030
Total fixed income securities .................. 37,156 145 (4) 37,297
Publicly traded equity securities ....................... 1,107 524 (11) 1,620
Total .................................. $38,263 $669 $ (15) $38,917
July 30, 2011
Amortized
Cost
Gross
Unrealized
Gains
Gross
Unrealized
Losses
Fair
Value
Fixed income securities:
U.S. government securities ......................... $19,087 $ 52 $ — $19,139
U.S. government agency securities ................... 8,742 35 (1) 8,776
Non-U.S. government and agency securities ........... 3,119 14 (1) 3,132
Corporate debt securities ........................... 4,333 65 (4) 4,394
Asset-backed securities ............................ 120 5 (4) 121
Total fixed income securities ................... 35,401 171 (10) 35,562
Publicly traded equity securities ......................... 734 639 (12) 1,361
Total .................................. $36,135 $810 $ (22) $36,923
U.S. government agency securities include corporate debt securities that are guaranteed by the Federal Deposit
Insurance Corporation (“FDIC”), while non-U.S. government and agency securities include agency and corporate
debt securities that are guaranteed by non-U.S. governments.
103