Cisco 2012 Annual Report Download - page 109
Download and view the complete annual report
Please find page 109 of the 2012 Cisco annual report below. You can navigate through the pages in the report by either clicking on the pages listed below, or by using the keyword search tool below to find specific information within the annual report.-
 1
1 -
2
-
3
-
4
-
5
-
6
-
7
-
8
-
9
-
10
-
11
-
12
-
13
-
14
-
15
-
16
-
17
-
18
-
19
-
20
-
21
-
22
-
23
-
24
-
25
-
26
-
27
-
28
-
29
-
30
-
31
-
32
-
33
-
34
-
35
-
36
-
37
-
38
-
39
-
40
-
41
-
42
-
43
-
44
-
45
-
46
-
47
-
48
-
49
-
50
-
51
-
52
-
53
-
54
-
55
-
56
-
57
-
58
-
59
-
60
-
61
-
62
-
63
-
64
-
65
-
66
-
67
-
68
-
69
-
70
-
71
-
72
-
73
-
74
-
75
-
76
-
77
-
78
-
79
-
80
-
81
-
82
-
83
-
84
-
85
-
86
-
87
-
88
-
89
-
90
-
91
-
92
-
93
-
94
-
95
-
96
-
97
-
98
-
 99
99 -
 100
100 -
 101
101 -
 102
102 -
 103
103 -
 104
104 -
 105
105 -
 106
106 -
 107
107 -
 108
108 -
 109
109 -
 110
110 -
 111
111 -
 112
112 -
 113
113 -
 114
114 -
 115
115 -
 116
116 -
 117
117 -
 118
118 -
 119
119 -
120
-
121
-
122
-
123
-
124
-
125
-
126
-
127
-
128
-
129
-
130
-
131
-
132
-
133
-
134
-
135
-
136
-
137
-
138
-
139
-
140
-
141
-
142
-
143
-
144
-
145
-
146
-
147
-
148
-
149
-
150
-
151
-
152
 |
 |

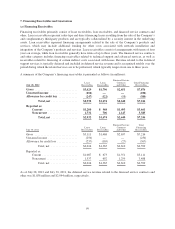
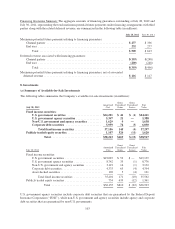
In circumstances when collectability is not deemed reasonably assured, the associated revenue is deferred in
accordance with the Company’s revenue recognition policies, and the related allowance for credit loss, if any, is
included in deferred revenue. The Company also records deferred revenue associated with financing receivables
when there are remaining performance obligations, as it does for financed service contracts. Total allowances for
credit loss and deferred revenue as of July 28, 2012 and July 30, 2011 were $2,387 million and $2,793 million,
respectively, and they were associated with financing receivables (net of unearned income) of $7,626 million and
$6,966 million as of their respective period ends. The losses that the Company has incurred historically,
including in the periods presented with respect to its financing receivables, have been immaterial and consistent
with the performance of an investment-grade portfolio. The Company did not modify any financing receivables
during the periods presented.
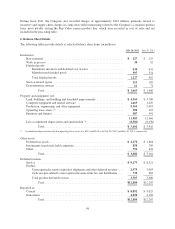
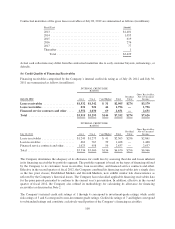
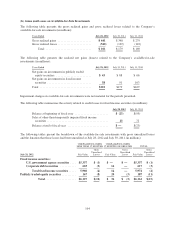
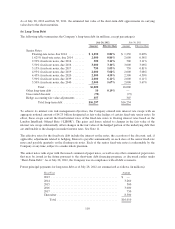
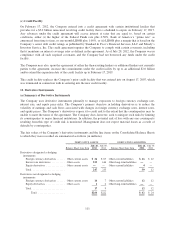
The following tables present the aging analysis of financing receivables as of July 28, 2012 and July 30, 2011 (in
millions):
DAYS PAST DUE (INCLUDES
BILLED AND UNBILLED)
July 28, 2012 31-60 61-90 91+
Total
Past Due Current
Gross
Receivables,
Net of
Unearned
Income
Non-Accrual
Financing
Receivables
Impaired
Financing
Receivables
Lease receivables ................. $151 $ 69 $173 $393 $2,786 $3,179 $23 $14
Loan receivables .................. 10 8 11 29 1,767 1,796 4 4
Financed service contracts and other 89 68 392 549 2,102 2,651 18 10
Total $250 $145 $576 $971 $6,655 $7,626 $45 $28
DAYS PAST DUE (INCLUDES
BILLED AND UNBILLED)
July 30, 2011 31-60 61-90 91+
Total
Past Due Current
Gross
Receivables,
Net of
Unearned
Income
Non-Accrual
Financing
Receivables
Impaired
Financing
Receivables
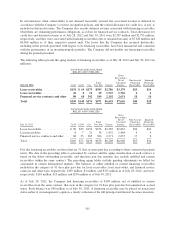
Lease receivables .................. $ 89 $35 $152 $276 $2,585 $2,861 $34 $24
Loan receivables .................. 8 7 21 36 1,432 1,468 4 4
Financed service contracts and other . . . 68 33 265 366 2,271 2,637 17 6
Total ............................ $165 $75 $438 $678 $6,288 $6,966 $55 $34
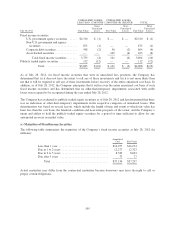
Past due financing receivables are those that are 31 days or more past due according to their contractual payment
terms. The data in the preceding tables is presented by contract and the aging classification of each contract is
based on the oldest outstanding receivable, and therefore past due amounts also include unbilled and current
receivables within the same contract. The preceding aging tables exclude pending adjustments on billed tax
assessment in certain international markets. The balances of either unbilled or current financing receivables
included in the category of 91 days plus past due for lease receivables, loan receivables, and financed service
contracts and other were, respectively, $139 million, $3 million, and $313 million as of July 28, 2012; and were,
respectively, $116 million, $15 million, and $230 million as of July 30, 2011.
As of July 28, 2012, the Company had financing receivables of $109 million, net of unbilled or current
receivables from the same contract, that were in the category for 91 days plus past due but remained on accrual
status. Such balance was $50 million as of July 30, 2011. A financing receivable may be placed on nonaccrual
status earlier if, in management’s opinion, a timely collection of the full principal and interest becomes uncertain.
101